Get instant access to this case solution for only $19
Hongxing Auto Sales and Service Co Case Solution
| Solution Id | Length | Case Author | Case Publisher |
|---|---|---|---|
| 1321 | 1039 Words (5 Pages) | James E. Hatch, Yuan Shi, Wei Sun | Ivey Publishing : 909N31 |
There are multiple risks associated with the discounted cash flows which are inherently present in the projection of cash flows. Firstly, the capital expenditures are projected for the calculation of free cash flows. As the number of periods increases, the uncertainty increases and hence the cash flows face large exposure. Secondly, the calculation of the discount rate is also risky in the discounted cash flow analysis. The weighted average cost of capital and the capital asset pricing model both techniques are quite theoretical and may not work in the real world. Another risk associated with the discount rate is the usage of growth in the dividend discount model. The growth rate which is used in dividend discount model is on a perpetual basis. The problem with this is again that anything in perpetual basis is strictly theoretical and may differ in the real practical world. Therefore, the discounted cash flows fluctuate significantly as they are predominantly dependent upon the assumptions which are made to project the cash flows. Therefore, assumptions must be realistic.
Following questions are answered in this case study solution
-
5 Years Pro forma Set of Financial Statements
-
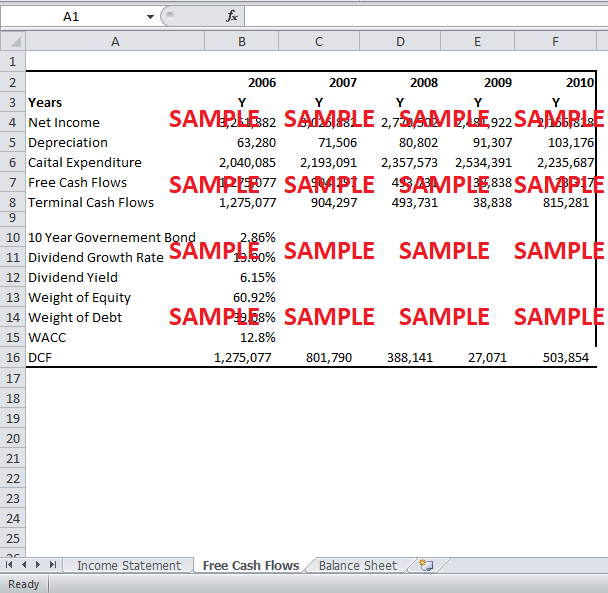
Five years Free Cash Flow and DCF Analysis
-
Discuss risk factors and their impact on your valuation.
-
Document and justify your calculation of terminal value.

Case Analysis for Hongxing Auto Sales and Service Co
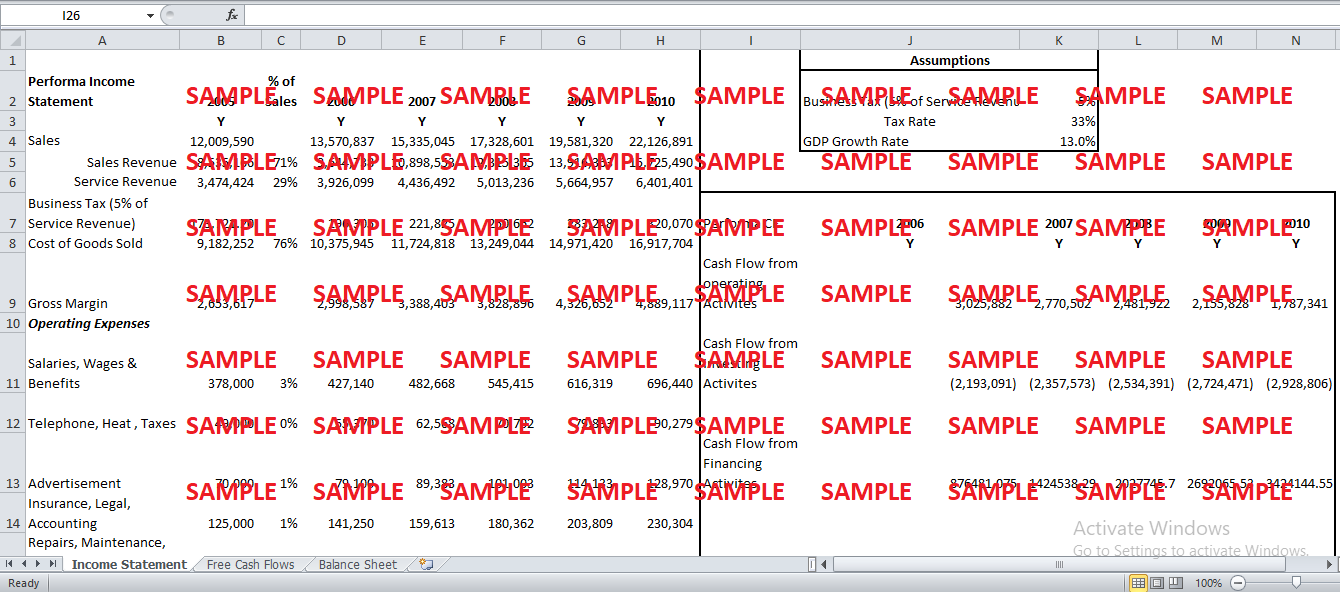
1. 5 Years Pro forma Set of Financial Statements
|
Assumptions |
|
|
Business Tax (5% of Service Revenue) |
5% |
|
Tax Rate |
33% |
|
GDP Growth Rate |
13.0% |
|
|
|||||||
|
Performa Income Statement |
2005 |
% of Sales |
2006 |
2007 |
2008 |
2009 |
2010 |
|
|
Y |
|
Y |
Y |
Y |
Y |
Y |
|
Sales |
12,009,590 |
|
13,570,837 |
15,335,045 |
17,328,601 |
19,581,320 |
22,126,891 |
|
Sales Revenue |
8,535,166 |
71% |
9,644,738 |
10,898,553 |
12,315,365 |
13,916,363 |
15,725,490 |
|
Service Revenue |
3,474,424 |
29% |
3,926,099 |
4,436,492 |
5,013,236 |
5,664,957 |
6,401,401 |
|
Business Tax (5% of Service Revenue) |
173,721.20 |
|
196,305 |
221,825 |
250,662 |
283,248 |
320,070 |
|
Cost of Goods Sold |
9,182,252 |
76% |
10,375,945 |
11,724,818 |
13,249,044 |
14,971,420 |
16,917,704 |
|
Gross Margin |
2,653,617 |
|
2,998,587 |
3,388,403 |
3,828,896 |
4,326,652 |
4,889,117 |
|
Operating Expenses |
|
|
|
|
|
|
|
|
Salaries, Wages & Benefits |
378,000 |
3% |
427,140 |
482,668 |
545,415 |
616,319 |
696,440 |
|
Telephone, Heat, Taxes |
49,000 |
0% |
55,370 |
62,568 |
70,702 |
79,893 |
90,279 |
|
Advertisement |
70,000 |
1% |
79,100 |
89,383 |
101,003 |
114,133 |
128,970 |
|
Insurance, Legal, Accounting |
125,000 |
1% |
141,250 |
159,613 |
180,362 |
203,809 |
230,304 |
|
Repairs, Maintenance, Tools & Supplies |
23,000 |
0% |
25,990 |
29,369 |
33,187 |
37,501 |
42,376 |
|
Office Expense & Travel |
22,000 |
0% |
24,860 |
28,092 |
31,744 |
35,870 |
40,534 |
|
Truck Operations |
73,000 |
1% |
82,490 |
93,214 |
105,331 |
119,025 |
134,498 |
|
Bad Debt |
8,000 |
0% |
9,040 |
10,215 |
11,543 |
13,044 |
14,739 |
|
Depreciation |
56,000 |
0% |
63,280 |
71,506 |
80,802 |
91,307 |
103,176 |
|
Total Operating Expense |
804,416 |
7% |
908,520 |
1,026,628 |
1,160,089 |
1,310,901 |
1,481,318 |
|
Earnings Before Interest & Taxes |
1,849,201 |
|
2,090,067 |
2,361,776 |
2,668,807 |
3,015,751 |
3,407,799 |
|
Interest |
33,480 |
|
200,000 |
200,000 |
200,000 |
200,000 |
200,000 |
|
Earnings Before Taxes |
1,815,721 |
|
1,890,067 |
2,161,776 |
2,468,807 |
2,815,751 |
3,207,799 |
|
Income Taxes |
599,188 |
|
623,722 |
713,386 |
814,706 |
929,198 |
1,058,574 |
|
Net Income After Interest & Taxes |
1,216,533 |
|
1,266,345 |
1,448,390 |
1,654,100 |
1,886,553 |
2,149,225 |
|
Retained Earnings Beginning |
2,235,349 |
|
3,251,882 |
3,025,882 |
2,770,502 |
2,481,922 |
2,155,828 |
|
Dividend |
200,000 |
2% |
226,000 |
255,380 |
288,579 |
326,095 |
368,487 |
|
Retained Earnings Closing |
3,251,882 |
|
3,025,882 |
2,770,502 |
2,481,922 |
2,155,828 |
1,787,341 |
|
Performa Balance Sheet |
|
|
|
|
|
|
|
|
|||||
|
|
2005 |
% Of Assets |
2006 |
2007 |
2008 |
2009 |
2010 |
|
|||||
|
Assets |
Y |
|
Y |
Y |
Y |
Y |
Y |
|
|||||
|
Current Assets |
|
|
|
|
|
|
|
|
|||||
|
Cash & Bank Deposit |
1,590,020 |
29.8% |
1,709,272 |
1,837,467 |
1,975,277 |
2,123,423 |
2,282,679 |
|
|||||
|
Accounts Receivable |
485,467 |
9.1% |
521,877 |
561,018 |
603,094 |
648,326 |
696,951 |
|
|||||
|
Inventories |
|
0.0% |
- |
- |
- |
- |
- |
|
|||||
|
Cars for Sale |
598,605 |
11.2% |
643,500 |
691,763 |
743,645 |
799,419 |
859,375 |
|
|||||
|
Work in Progress |
166,583 |
3.1% |
179,077 |
192,507 |
206,946 |
222,466 |
239,151 |
|
|||||
|
Prepaid Expenses |
149,900 |
2.8% |
161,143 |
173,228 |
186,220 |
200,187 |
215,201 |
|
|||||
|
Purchase Rebate Receivable |
159,657 |
3.0% |
171,631 |
184,504 |
198,341 |
213,217 |
229,208 |
|
|||||
|
Deposit with Supplier |
17,995 |
0.3% |
19,345 |
20,795 |
22,355 |
24,032 |
25,834 |
|
|||||
|
Other Current |
5,294 |
0.1% |
5,691 |
6,118 |
6,577 |
7,070 |
7,600 |
|
|||||
|
Total Current Assets |
3,173,521 |
|
3,411,535 |
3,667,400 |
3,942,455 |
4,238,139 |
4,556,000 |
|
|||||
|
Non-Current Assets |
|
|
|
|
|
|
|
|
|||||
|
Land |
1,700,000 |
31.8% |
1,827,500 |
1,964,563 |
2,111,905 |
2,270,298 |
2,440,570 |
|
|||||
|
Building |
310,311 |
5.8% |
333,584 |
358,603 |
385,498 |
414,411 |
445,492 |
|
|||||
|
Equipment & Furniture |
8,678 |
0.2% |
9,329 |
10,029 |
10,781 |
11,589 |
12,458 |
|
|||||
|
Automotive Equipment |
20,707 |
0.4% |
22,260 |
23,930 |
25,724 |
27,654 |
29,728 |
|
|||||
|
Other |
389 |
0.0% |
418 |
450 |
483 |
519 |
558 |
|
|||||
|
Total |
2,040,085 |
|
2,193,091 |
2,357,573 |
2,534,391 |
2,724,471 |
2,928,806 |
|
|||||
|
Good Will |
123,935 |
2.3% |
133,230 |
143,222 |
153,964 |
165,511 |
177,925 |
|
|||||
|
Total Assets |
5,337,541 |
|
5,737,857 |
6,168,196 |
6,630,811 |
7,128,121 |
7,662,730 |
|
|||||
|
Liabilities & Equity |
|
|
|
|
|
|
|
|
|||||
|
Bank Loan |
|
|
|
|
|
|
|
|
|||||
|
Accounts Payable & Accruals |
474,950 |
8.9% |
969,463 |
1,512,063 |
2,107,789 |
2,762,241 |
3,481,648 |
|
|||||
|
Taxes Payable |
810,709 |
15.2% |
871,512 |
936,876 |
1,007,141 |
1,082,677 |
1,163,878 |
|
|||||
|
Current Long Term Debt |
|
|
|
|
|
|
|
|
|||||
|
Dividend Payable |
200,000 |
3.7% |
226,000 |
255,380 |
288,579 |
326,095 |
368,487 |
|
|||||
|
Total Current Liabilities |
1,485,659 |
|
2,066,975 |
2,704,319 |
3,403,510 |
4,171,012 |
5,014,012 |
|
|||||
|
Long Term Debt |
600,000 |
11.2% |
645,000 |
693,375 |
745,378 |
801,281 |
861,378 |
|
|||||
|
Shareholders’ Equity |
|
|
|
|
|
|
|
|
|||||
|
Common Stock Retained Earnings |
3,251,882 |
|
3,025,882 |
2,770,502 |
2,481,922 |
2,155,828 |
1,787,341 |
|
|||||
|
Total Liabilities & Equity |
5,337,541 |
|
5,737,857 |
6,168,196 |
6,630,811 |
7,128,121 |
7,662,730 |
|
|||||
|
Performa CF |
2006 |
2007 |
2008 |
2009 |
2010 |
||||||||
|
|
Y |
Y |
Y |
Y |
Y |
||||||||
|
Cash Flow from operating activities |
3,025,882 |
2,770,502 |
2,481,922 |
2,155,828 |
1,787,341 |
||||||||
|
|
|
|
|
|
|
||||||||
|
Cash Flow from Investing Activities |
(2,193,091) |
(2,357,573) |
(2,534,391) |
(2,724,471) |
(2,928,806) |
||||||||
|
|
|
|
|
|
|
||||||||
|
Cash Flow from Financing Activities |
876481.075 |
1424538.29 |
2027745.7 |
2692065.53 |
3424144.55 |
||||||||
|
|
|
|
|
|
|
||||||||
|
Total Cash |
1,709,272 |
1,837,467 |
1,975,277 |
2,123,423 |
2,282,679 |
||||||||
Get instant access to this case solution for only $19
Get Instant Access to This Case Solution for Only $19
Standard Price
$25
Save $6 on your purchase
-$6
Amount to Pay
$19
Different Requirements? Order a Custom Solution
Calculate the Price
Related Case Solutions
Get More Out of This
Our essay writing services are the best in the world. If you are in search of a professional essay writer, place your order on our website.

