Get instant access to this case solution for only $19
Hurtigruten Sailing Into Warm Water Case Solution
| Solution Id | Length | Case Author | Case Publisher |
|---|---|---|---|
| 2237 | 1597 Words (10 Pages) | Jan W. Rivkin, Kerry Herman | Harvard Business School : 720410 |
Hurtigruten is a multiple-storied ferry and cruise operator based in Norway which is involved in ferrying passengers and cargo up and down the rugged Norwegian coast. Over the last many decades, the company has faced financial turbulence whereby many times government had to come up for the rescue of the company. However, a change in management in 2012 with Danial Skjeldam as the new CEO, the company started to restructure its business operations which turned out to be successful. Resultantly, the company reported an operating profit of $78M in 2018 as compared to only $9M in 2012 when Skjeldam took the charge. Along with operating as a provider of the polar expedition in a competitive market, now the company is wrestling with a question that whether or not to compete in warm places like the South Pacific, Australia, and Africa’s coast.
Following questions are answered in this case study solution
-
Introduction
-
Company’s current strategy
-
Evaluation of current strategy performance
-
External Analysis
-
Internal Analysis
-
Problem Statement
-
Alternative Strategies
-
Strategy Recommendation
Case Analysis for Hurtigruten Sailing Into Warm Water
2. Company’s current strategy
Currently, the financial position of the company is weak but under the leadership of the new CEO, the company is focusing to improve the image of the soft side of the product. For instance, providing better food offerings and procuring local produce on the port along the route allows passengers to relate to a specific region.
2.1. Vision
The company has the vision to be a global leader in the expedition industry.
2.2. Mission
The mission was to provide safe, remarkable, different & unique, and sustainable travel experiences that create lifelong memories.
2.3. Objective
Hurtigruten’s objective was to be an expedition company with service quality and better products such as memorable experiences at each stop, educating passengers about local traditions, and providing adventures.
2.4. Corporate level strategy
The company intends to be an active participant in contributing to strengthening the corporation and sense of community in their global business.
2.5. Business level strategy
The newly build management team aims for business growth and reduces the business’ dependence on government contracts while making the company more independent.
3. Evaluation of current strategy performance
3.1. Competitive performance;
Hurtigruten penetration in the polar segment of the market for expedition cruise gave them competitive advantages over other conventional cruise operators. For instance, conventional cruise carries thousands of guests while expedition cruises carry only few hundred passengers allowing them to provide a unique and customized experience to the passengers. Moreover, the conventional cruise due to its large size could make port at massive docks which limits its ability to provide an opportunity to explore off-the-beaten-track locations and can only focus on onboard activities. On the other hand, expedition cruises provide both onboard and off-board adventures.
It is pertinent to mention that Hurtigruten operated across four segments namely the Norwegian coast, the expedition, the land, and the coastal government agreements. In the first three segments, the company has recorded growth of 10.8%, 27.5%, and 9.6% respectively with served hundreds of thousands of passengers. The coastal government agreement remained a segment with negative growth since previously Hurtigruten was the sole winner of government tenders however in 2018 the government added another company on its panel diluting the market share for Hurtigruten.
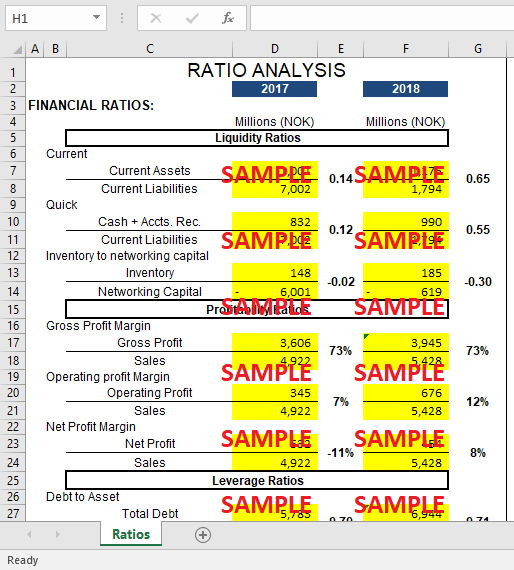
3.2. Financial performance
The company does not have healthy liquidity ratios showing that the company may be in a week position to meet its short-term obligations. Profitability ratios are satisfactory whereby operating profit margin increased from 7% in 2017 to 12% in 2018. The net profit margin was negative in 2017 however the company was able to record a positive net profit margin in 2018. Leverage is on the higher side which indicates that the dependence on borrowing is higher as compared to owner’s equity. However, if debt service coverage and interest coverage are sufficient, the company can manage higher debt levels. Activity ratios seem satisfactory with healthy inventory and receivable turnovers. Moreover, the collection period is also short.
|
RATIO ANALYSIS |
||||||
|
|
|
|
2017 |
|
2018 |
|
|
FINANCIAL RATIOS: |
|
|
|
|
||
|
|
|
|
Millions (NOK) |
|
Millions (NOK) |
|
|
|
|
Liquidity Ratios |
|
|||
|
|
Current |
|
|
|
|
|
|
|
|
Current Assets |
1,001 |
0.14 |
1,175 |
0.65 |
|
|
|
Current Liabilities |
7,002 |
1,794 |
||
|
|
Quick |
|
|
|
|
|
|
|
|
Cash + Accts. Rec. |
832 |
0.12 |
990 |
0.55 |
|
|
|
Current Liabilities |
7,002 |
1,794 |
||
|
|
Inventory to networking capital |
|
|
|
|
|
|
|
|
Inventory |
148 |
-0.02 |
185 |
-0.30 |
|
|
|
Networking Capital |
- 6,001 |
- 619 |
||
|
|
|
Profitability Ratios |
|
|||
|
|
Gross Profit Margin |
|
|
|
|
|
|
|
|
Gross Profit |
3,606 |
73% |
3,945 |
73% |
|
|
|
Sales |
4,922 |
5,428 |
||
|
|
Operating profit Margin |
|
|
|
|
|
|
|
|
Operating Profit |
345 |
7% |
676 |
12% |
|
|
|
Sales |
4,922 |
5,428 |
||
|
|
Net Profit Margin |
|
|
|
|
|
|
|
|
Net Profit |
- 532 |
-11% |
454 |
8% |
|
|
|
Sales |
4,922 |
5,428 |
||
|
|
|
Leverage Ratios |
|
|||
|
|
Debt to Asset |
|
|
|
|
|
|
|
|
Total Debt |
5,783 |
0.70 |
6,944 |
0.71 |
|
|
|
Total Assets |
8,267 |
9,760 |
||
|
|
Debt to equity |
|
|
|
|
|
|
|
|
Total Debt |
5,783 |
12.71 |
6,944 |
9.92 |
|
|
|
Total Equity |
455 |
700 |
||
|
|
|
Activity Ratios |
|
|||
|
|
Inventory Turnover |
|
|
|
|
|
|
|
|
Cost of Goods Sold |
1,317 |
8.90 |
1,483 |
8.02 |
|
|
|
Inventory |
148 |
185 |
||
|
|
Accounts Receivable Turnover |
|
|
|
|
|
|
|
|
Sales |
4,922 |
12.49 |
5,428 |
12.68 |
|
|
|
Accounts Receivable |
394 |
428 |
||
|
|
Average collection period |
|
|
|
|
|
|
|
|
360 |
360 |
28.82 |
360 |
12.49 |
|
|
|
Accts. Rec. Turnover |
12 |
4 |
||
|
|
Asset Turnover |
|
|
|
|
|
|
|
|
Sales |
4,922 |
0.60 |
5,428 |
0.56 |
|
|
|
Asset |
8,267 |
9,760 |
||
|
|
Fixed assets turnover |
|
|
|
|
|
|
|
|
Sales |
4,922 |
1.14 |
5,428 |
1.20 |
| Fixed Assets | 4,302 | 4,528 | ||||
(Hurtigruten, 2018)
4. External Analysis
4.1. General external environment
There are dozens of cruise lines and itineraries to choose from. The passengers from across the globe have unique preferences and eager to see wildlife, observe nature closely and learn about the native communities. Some passengers would become loyal to the cruise while others would eagerly travel on a well-reputed brand that offered a cruise to the desired destination. Companies vary on account of several factors including the regions they covered, the number of itineraries they sailed, the size of the ship, and the level of luxury.
Get instant access to this case solution for only $19
Get Instant Access to This Case Solution for Only $19
Standard Price
$25
Save $6 on your purchase
-$6
Amount to Pay
$19
Different Requirements? Order a Custom Solution
Calculate the Price
Related Case Solutions
Get More Out of This
Our essay writing services are the best in the world. If you are in search of a professional essay writer, place your order on our website.

