Get instant access to this case solution for only $19
BNL Stores Case Solution
| Solution Id | Length | Case Author | Case Publisher |
|---|---|---|---|
| 2469 | 1284 Words (14 Pages) | Paul Cruz | Ivey Publishing : 9B12B027 |
Retail giant BNL store has been in operation for more than four decades. At its core, it is a company based in the Midwest of the US. An important part of the company's expansion strategy is to build huge, public superstores where a wide variety of products may be offered to the general public. As a result, new central superstores may take the place of the city's traditional trade cheap shops and provide a greater range of goods and services to the general public. The company's freshly established shops offer long-lasting items, as well as high-end appliances and furniture. Shop credit is also in place in these new enterprises. If the store manager has the authority to do so, customer credit may be provided. A financing facility has been set up to make it simpler for people to acquire high-end items. This is in addition to a bonus-based structure that rewards store managers with a percentage of net income generated each year. Businesses may be pushed to provide shop credit to even the most unreliable customers in order to stimulate sales. This has had a significant effect on BNL's business. Customers were given store credits without necessary credit checks in order to get substantial rewards from the business manager. Due to a rise in credit sales, the company found itself short on cash. In the previous several years, the stock of the corporation has dropped from $100 to $10. Share prices continued to fall, despite the fact that the company had previously paid handsome dividends on its stock. As a consequence of the stock's poor performance, investors lost trust in the company. If the company wants to avoid bankruptcy, it must make critical decisions and execute necessary changes to its business strategy. Cash flow shows that despite the company's decrease in cash; it has been making a lot of credit sales.
Following questions are answered in this case study solution
-
Calculate the 11 ratios done in Exhibit 4 for each year from 2018 to 2020. Do you notice any trends? What insights do these trends provide into operations of BNL? Could you please show the calculations?
Case Analysis for BNL Stores
1. Calculate the 11 ratios done in Exhibit 4 for each year from 2018 to 2020. Do you notice any trends? What insights do these trends provide into operations of BNL? Could you please show the calculations?
Ans:
|
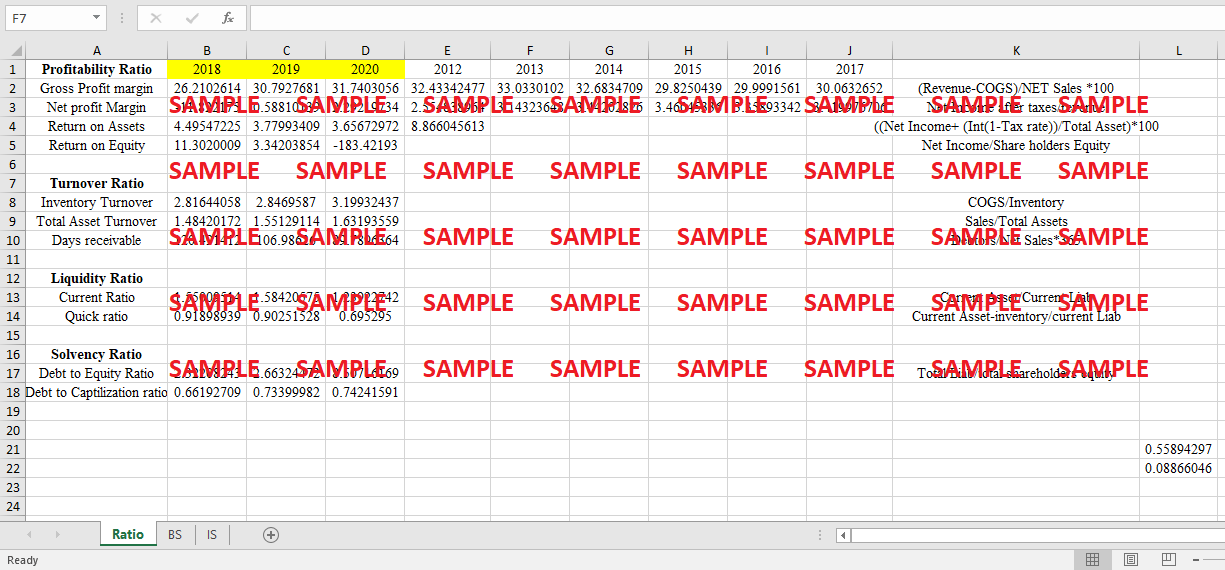
Profitability Ratio |
2018 |
2019 |
2020 |
2012 |
2013 |
2014 |
2015 |
2016 |
2017 |
|
|
|
Gross Profit margin |
26.2102614 |
30.7927681 |
31.7403056 |
32.43342477 |
33.0330102 |
32.6834709 |
29.8250439 |
29.9991561 |
30.0632652 |
(Revenue-COGS)/NET Sales *100 |
|
|
Net profit Margin |
-11.822175 |
0.58810139 |
2.29219734 |
2.554838964 |
3.14323648 |
3.44202826 |
3.46045336 |
3.35893342 |
3.41997671 |
Net Income after taxes/revenue |
|
|
Return on Assets |
4.49547225 |
3.77993409 |
3.65672972 |
8.866045613 |
|
|
|
|
|
((Net Income+ (Int(1-Tax rate))/Total Asset)*100 |
|
|
Return on Equity |
11.3020009 |
3.34203854 |
-183.42193 |
|
|
|
|
|
|
Net Income/Share holders Equity |
|
|
|
|
|
|
|
|
|
|
|
|
|
|
|
Turnover Ratio |
|
|
|
|
|
|
|
|
|
|
|
|
Inventory Turnover |
2.81644058 |
2.8469587 |
3.19932437 |
|
|
|
|
|
|
COGS/Inventory |
|
|
Total Asset Turnover |
1.48420172 |
1.55129114 |
1.63193559 |
|
|
|
|
|
|
Sales/Total Assets |
|
|
Days receivable |
120.491412 |
106.98626 |
89.7896364 |
|
|
|
|
|
|
Debtors/Net Sales*365 |
|
|
|
|
|
|
|
|
|
|
|
|
|
|
|
Liquidity Ratio |
|
|
|
|
|
|
|
|
|
|
|
|
Current Ratio |
1.55009514 |
1.58420575 |
1.23922742 |
|
|
|
|
|
|
Current Asset/Current Liab |
|
|
Quick ratio |
0.91898939 |
0.90251528 |
0.695295 |
|
|
|
|
|
|
Current Asset-inventory/current Liab |
|
|
|
|
|
|
|
|
|
|
|
|
|
|
|
Solvency Ratio |
|
|
|
|
|
|
|
|
|
|
|
|
Debt to Equity Ratio |
2.32208243 |
2.66324472 |
8.50716169 |
|
|
|
|
|
|
Total Liab/total shareholders equity |
|
|
Debt to Captilization ratio |
0.66192709 |
0.73399982 |
0.74241591 |
|
|
|
|
|
|
|
|
|
|
|
|
|
|
|
|
|
|
|
|
|
|
|
|
|
|
|
|
|
|
|
|
|
|
|
|
|
|
|
|
|
|
|
|
|
|
0.55894297 |
|
|
|
|
|
|
|
|
|
|
|
|
0.08866046 |
|
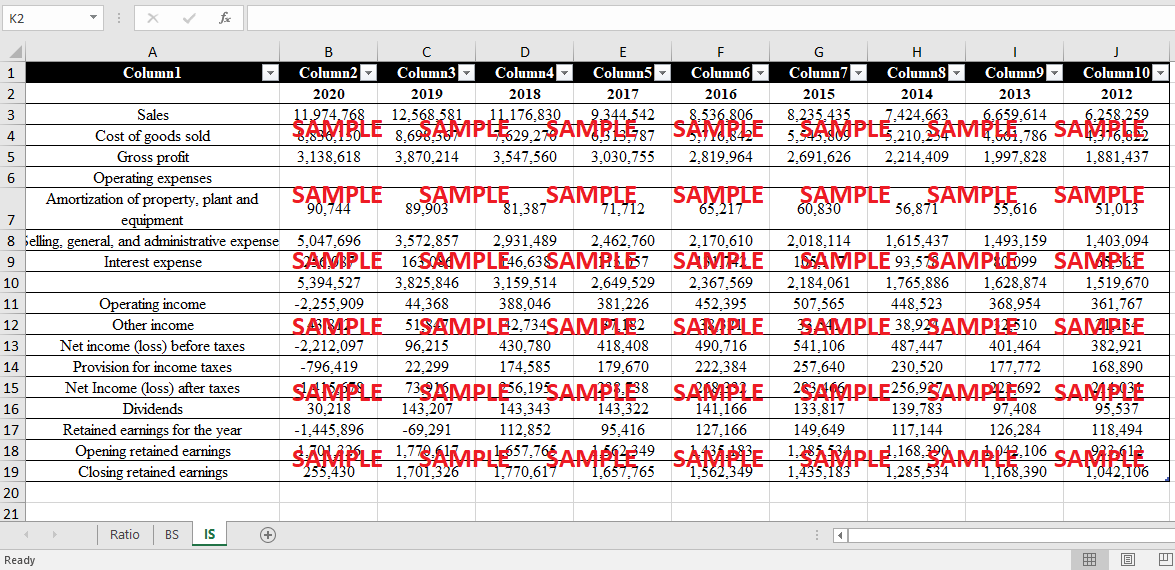
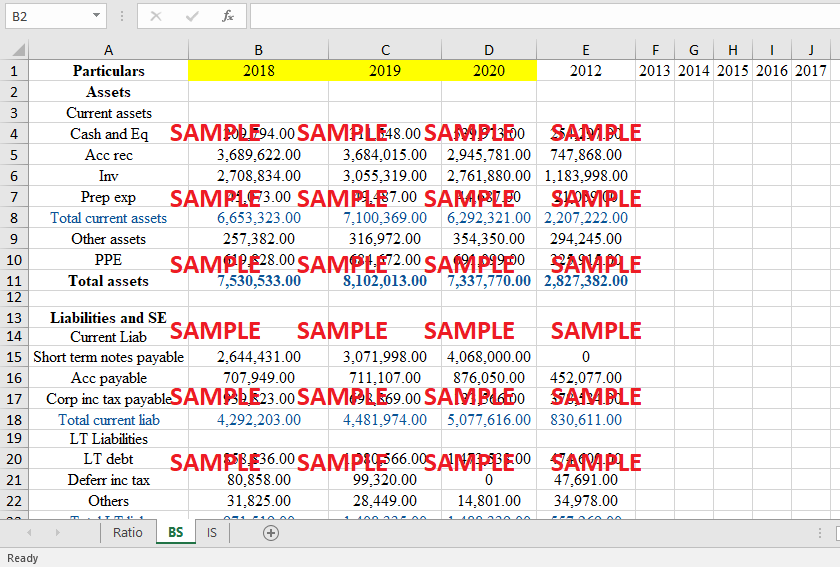
Particulars |
2018 |
2019 |
2020 |
2012 |
2013 |
2014 |
2015 |
2016 |
2017 |
|
Assets |
|
|
|
|
|
|
|
|
|
|
Current assets |
|
|
|
|
|
|
|
|
|
|
Cash and Eq |
209,794.00 |
311,548.00 |
539,973.00 |
254,297.00 |
|
|
|
|
|
|
Acc rec |
3,689,622.00 |
3,684,015.00 |
2,945,781.00 |
747,868.00 |
|
|
|
|
|
|
Inv |
2,708,834.00 |
3,055,319.00 |
2,761,880.00 |
1,183,998.00 |
|
|
|
|
|
|
Prep exp |
45,073.00 |
49,487.00 |
44,687.00 |
21,059.00 |
|
|
|
|
|
|
Total current assets |
6,653,323.00 |
7,100,369.00 |
6,292,321.00 |
2,207,222.00 |
|
|
|
|
|
|
Other assets |
257,382.00 |
316,972.00 |
354,350.00 |
294,245.00 |
|
|
|
|
|
|
PPE |
619,828.00 |
684,672.00 |
691,099.00 |
325,915.00 |
|
|
|
|
|
|
Total assets |
7,530,533.00 |
8,102,013.00 |
7,337,770.00 |
2,827,382.00 |
|
|
|
|
|
|
|
|
|
|
|
|
|
|
|
|
|
Liabilities and SE |
|
|
|
|
|
|
|
|
|
|
Current Liab |
|
|
|
|
|
|
|
|
|
|
Short term notes payable |
2,644,431.00 |
3,071,998.00 |
4,068,000.00 |
0 |
|
|
|
|
|
|
Acc payable |
707,949.00 |
711,107.00 |
876,050.00 |
452,077.00 |
|
|
|
|
|
|
Corp inc tax payable |
939,823.00 |
698,869.00 |
133,566.00 |
378,534.00 |
|
|
|
|
|
|
Total current liab |
4,292,203.00 |
4,481,974.00 |
5,077,616.00 |
830,611.00 |
|
|
|
|
|
|
LT Liabilities |
|
|
|
|
|
|
|
|
|
|
LT debt |
858,836.00 |
1,280,566.00 |
1,473,538.00 |
474,600.00 |
|
|
|
|
|
|
Deferr inc tax |
80,858.00 |
99,320.00 |
0 |
47,691.00 |
|
|
|
|
|
|
Others |
31,825.00 |
28,449.00 |
14,801.00 |
34,978.00 |
|
|
|
|
|
|
Total LT liab |
971,519.00 |
1,408,335.00 |
1,488,339.00 |
557,269.00 |
|
|
|
|
|
|
Share Eq |
|
|
|
|
|
|
|
|
|
|
Share cap |
496,194.00 |
510,378.00 |
516,385.00 |
397,396.00 |
|
|
|
|
|
|
Net Earnings |
1,770,617.00 |
1,701,326.00 |
255,430.00 |
1,042,106.00 |
|
|
|
|
|
|
Total Equity |
2,266,811.00 |
2,211,704.00 |
771,815.00 |
1,439,502.00 |
|
|
|
|
|
|
Liabilities and SE |
7,530,533.00 |
8,102,013.00 |
7,337,770.00 |
2,827,382.00 |
|
|
|
|
Get instant access to this case solution for only $19
Get Instant Access to This Case Solution for Only $19
Standard Price
$25
Save $6 on your purchase
-$6
Amount to Pay
$19
Different Requirements? Order a Custom Solution
Calculate the Price
Related Case Solutions
Get More Out of This
Our essay writing services are the best in the world. If you are in search of a professional essay writer, place your order on our website.

