Get instant access to this case solution for only $19
Kaufmann Manufacturing Co (A) and (B) Case Solution
| Solution Id | Length | Case Author | Case Publisher |
|---|---|---|---|
| 1209 | 1173 Words (6 Pages) | Julie H. Hertenstein | Harvard Business School : 193159 and 193160 |
By carefully examining the price of the product, Kaufmann clearly performed better in the second half of the year. However, there is one exception for this case. The labor variance in the 3nd half of the year is still unfavorable. However, there are certain reasons for that. This is because of the fact that the production experienced a boost in the 2nd half. The increase in the production of the product has caused the variance of direct labor to still remain unfavorable. Another reason for the seemingly better performance of Kaufmann in the second half is that it produced excess products in comparison to the amount it sold. This resulted in the deferral of a portion of the fixed costs in the inventory (inventory contained some fixed costs that might have altered the profitability and variance for Kaufmann).Therefore, this point artificially accentuated the profitability situation of the company.
Following questions are answered in this case study solution
-
During the first half of 1992, Kaufmann Manufacturing Company just about broken even on sales of 212,000 units. In comparison, during the second half of 1992, when sales were only 188,000 units, operating income was $1,619,800. Briefly explain this apparent inconsistency.
-
Look at Exhibits 1 and 2, which are Carlo Chavez’s performance reports. Why do you think that Carlos chose to present his analysis in the way that you can calculate Carlos’s variances for raw materials and power?
-
How did Carlos calculate the variances in Column 4 of Exhibit 1? Show that you can calculate Carlos’s variance for raw material and power.
-
Compute Sales, direct material, direct labor and overhead variances for each six-month period separately, using the information in Exhibits 1 through 4 in the [A] case.
-
Compare and evaluate Kaufmann’s performance for the first six months and the second six months of 1992. Further, how would you evaluate the performance of the sale manager? Of the manufacturing manager? Write an explanation for Mary Kaufmann summarizing your analysis. Attach exhibits that explain your calculations and results.
-
Based on your analysis, what recommendations would make to Mary Kaufmann, Carlos Chavez, and/or Sandy Stevens?
Case Analysis for Kaufmann Manufacturing Co (A) and (B)
1. During the first half of 1992, Kaufmann Manufacturing Company just about broke even on sales of 212,000 units. In comparison, during the second half of 1992, when sales were only 188,000 units, operating income was $1,619,800. Briefly explain this apparent inconsistency.
The reason for high profit in the second half of the year despite low comparative sales is that the company has maximized its profits by altering the price of the product. In the first half of the year, the product price comes out to be equal to:
Unit Price Charged = (Actual Revenue) / (Actual Sales units) = 19080000 / 212000 = 90
On the contrary, during the second half of the year, the unit price that Kaufmann charged was relatively high.
Unit Price Charged = (Actual Revenue) / (Actual Sales units) = 17484000 / 188000 = 93
The rise in price caused the demand curve to shift to the right. Hence, even though fewer units were sold, the $3 increase in price allowed Kaufmann to gain a profit advantage. Moreover, Kaufmann also realized the comparatively low per-unit cost of sales. Both these factors allowed Kaufmann to optimize their profit figure and that is why it realized huge profits in the second half of the year even when the unit sales were not at par with the first half’s sales.
2. Look at Exhibits 1 and 2, which are Carlo Chavez’s performance reports. Why do you think that Carlos chose to present his analysis in the way that you can calculate Carlos’s variances for raw materials and power?
There could be various reasons for choosing a specific format. However, the prime reason for showing the performance report in this format is that it can be used to link various scenarios and the resulting operating income can be compared with each other. One of the basic aims of budgeting is the variance analysis of the output and the input. The proposed format provides a variance analysis for all inputs. The variance in this scenario is also calculated by a simple method that follows intuition rather than the desired formula.
3. How did Carlos calculate the variances in Column 4 of Exhibit 1? Show that you can calculate Carlos’s variance for raw material and power.
Carlos calculated the variances in the table by using the most simple and intuitive concept. The variance is defined as the deviation from the actual value. In the current case, there is a standard cost procedure put in place. However, the actual costs may differ from the standard costs giving rise to variance. The formula used by Carol is as follows.
Unit Price Charged = (Actual Revenue) / (Actual Sales units) = 17484000 / 188000 = 93
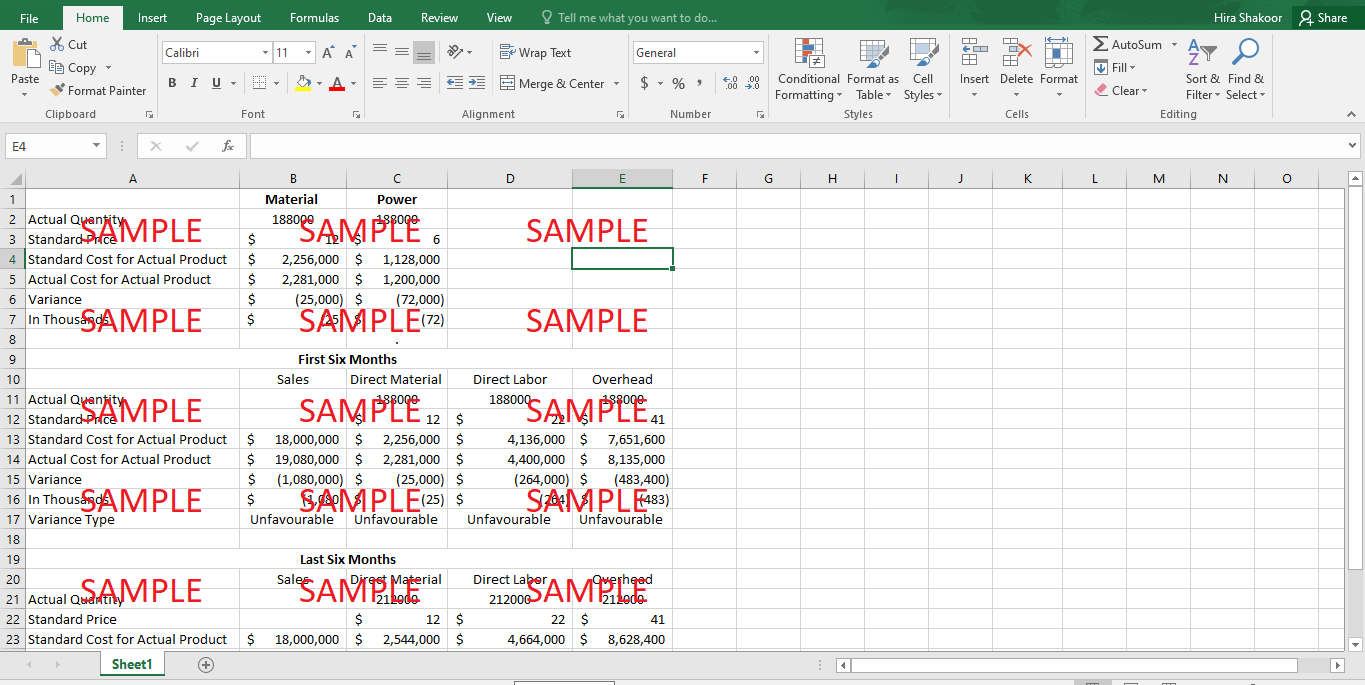
In the case of direct material, 188000 units were produced in the first six months. The standard cost for one product is $12 (3*$4). This means that the standard cost for the actual product comes out to be $2256000 (188000*12). The actual cost listed in the income statement is, however, $2281000. The difference comes out to be -$25000. This is equal to the variance of 25000U listed by Carol. Similarly, for power, the Standard price is $6 per product. This gives rise to $1128000 standard costs (for the actual product). The actual costs listed on the income statement is $1200000. This gives rise to -$72000 (unfavorable) variance.
|
|
Material |
Power |
|
Actual Quantity |
188000 |
188000 |
|
Standard Price |
$12 |
$6 |
|
Standard Cost for Actual Product |
$2,256,000 |
$1,128,000 |
|
Actual Cost for Actual Product (From Income Statement) |
$2,281,000 |
$1,200,000 |
|
Variance |
$(25,000) |
$(72,000) |
|
In Thousands |
$(25) |
$(72) |
Get instant access to this case solution for only $19
Get Instant Access to This Case Solution for Only $19
Standard Price
$25
Save $6 on your purchase
-$6
Amount to Pay
$19
Different Requirements? Order a Custom Solution
Calculate the Price
Related Case Solutions
Get More Out of This
Our essay writing services are the best in the world. If you are in search of a professional essay writer, place your order on our website.

