Get instant access to this case solution for only $19
Pelican Instruments Inc Case Solution
| Solution Id | Length | Case Author | Case Publisher |
|---|---|---|---|
| 1187 | 1373 Words (9 Pages) | Vijay Govindarajan, John K. Shank |
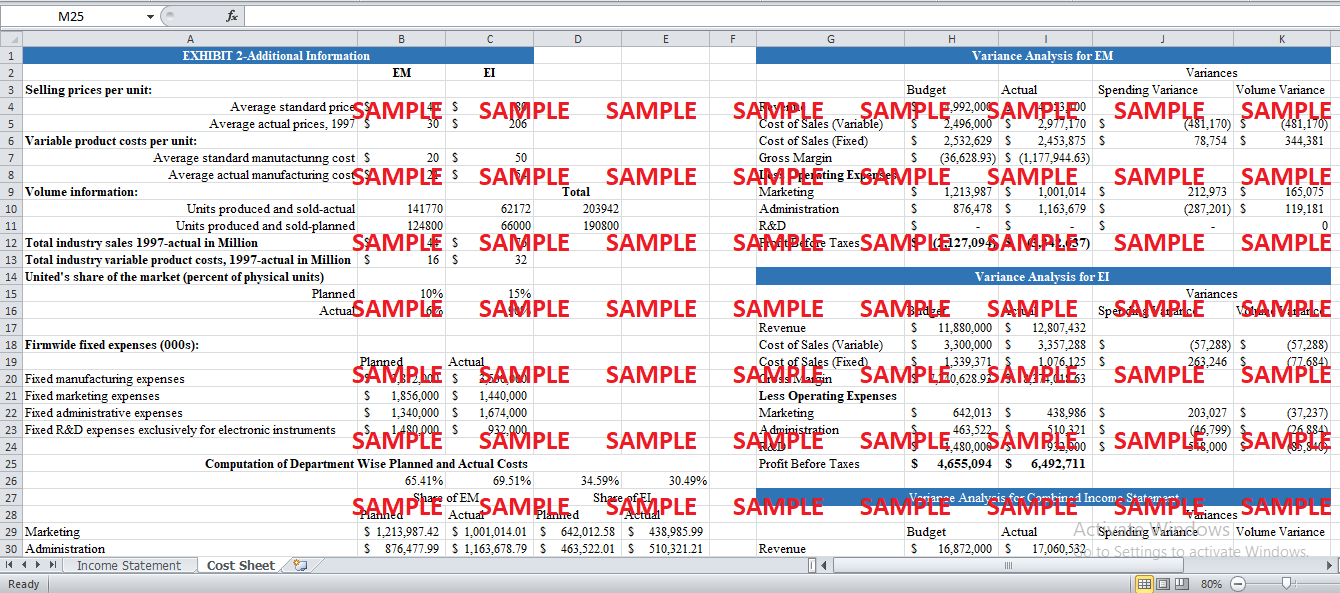
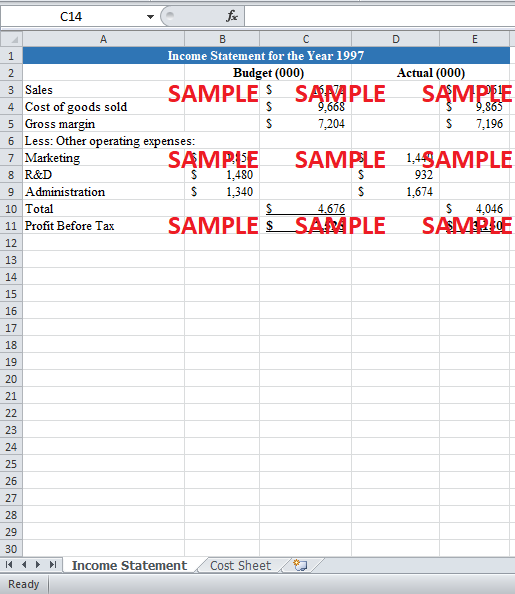
The favorable profit variance for 1997 is almost $622,000. However, Park needed to know about the details of this breakup for each department and for each product. For this purpose, three different variance analyses are to be carried out. The first variance analysis pertains to the overall performance of the company. It does not take into account the individual product lines. The rest of the two variance analyses should break up the overall expense figure to shed light on the individual performance of the departments. In order to compute the variance for fixed overheads (expenses), one can rely on either the spending or volume variance. As both are crucial for the decision-making process, therefore, both variances need to be computed.
Following questions are answered in this case study solution
-
Prepare the report that you feel Amy Shultz should present to Mr. Park.
-
Put yourself in the position of the following six managers: general manager (EM); marketing manager (EM); manufacturing manager (EM); general manager (EI); marketing manager (El); manufacturing manager (EI). These six managers compete for a share in the company's bonus pool. For each of the six, how would you make a case for your obtaining a share of the bonus pool?
-
As Mr. Park, how would you feel about the.1997 performance of each of the six managers who are competing for a share of the bonus pool?
Case Analysis for Pelican Instruments Inc
1. Prepare the report that you feel Amy Shultz should present to Mr. Park.
Fixed overhead spending and volume variances can be calculated by using the following formulas:
Fixed Overhead Spending Variance = Actual Overhead - Budgeted Overhead
Fixed Overhead Volume Variance = ((Budgeted Fixed Overhead) / (Budgeted Units / Production)) * (Actual units - Budgeted Units)
For the computation of company-wise variances, the overall overhead amounts can be used. The following table provides the variance analysis for company-wise overheads:
|
Variance Analysis for Combined Income Statement |
||||
|
|
|
|
Variances |
|
|
|
Budget |
Actual |
Spending Variance |
Volume Variance |
|
Revenue |
$16,872,000 |
$17,060,532 |
|
|
|
Cost of Sales (Variable) |
$5,796,000 |
$6,334,458 |
$(538,458) |
$(538,458) |
|
Cost of Sales (Fixed) |
$3,872,000 |
$3,530,000 |
$342,000 |
$266,697 |
|
Gross Margin |
$7,204,000 |
$7,196,074 |
|
|
|
Less Operating Expenses |
|
|
|
|
|
Marketing |
$1,856,000 |
$1,440,000 |
$416,000 |
$127,838.32 |
|
Administration |
$1,340,000 |
$1,674,000 |
$(334,000) |
$92,297.06 |
|
R&D |
$1,480,000 |
$932,000 |
$548,000 |
$(85,840.00) |
|
Profit Before Taxes |
$2,528,000 |
$3,150,074 |
|
|
All the values of spending variance are favorable except for the fixed administrative expenses which are unfavorable to ($334,000). Similarly, all volume variances are also favorable with the exception of R&D expense. Overall, it seems that the company performed really well in comparison to the budgeted figures. However, the fixed expenses need to be divided among the two product lines so that the variance for individual product lines can also be computed. For this purpose, let's assume that fixed expenses are divided into the ratio of the production capacity. For example, if the budget shows that 30% production comprises of EM units, then 30% of the relevant fixed costs will be allocated to EM for computation of budgeted figures. However, if actual production for EM is 40%, then the same 40% of the relevant fixed costs will be inputted for the computation of actual fixed costs. In this manner, one can divide the budgeted and actual costs among the four departments, manufacturing, marketing, administration and R&D. As per the budget, 65.41% of all the fixed costs are allocated to EM. However, actual numbers raise this allocation to 69.51%. On the contrary, the actual allocation for EI has decreased to 30.49% from 34.59%. The following two tables show the detailed variance analysis for two product lines and all the four departments:
|
Variance Analysis for EM |
||||
|
|
|
|
Variances |
|
|
|
Budget |
Actual |
Spending Variance |
Volume Variance |
|
Revenue |
$4,992,000 |
$4,253,100 |
|
|
|
Cost of Sales (Variable) |
$2,496,000 |
$2,977,170 |
$(481,170) |
$(481,170) |
|
Cost of Sales (Fixed) |
$2,532,629 |
$2,453,875 |
$78,754 |
$344,381 |
|
Gross Margin |
$(36,628.93) |
$ (1,177,944.63) |
|
|
|
Less Operating Expenses |
|
|
|
|
|
Marketing |
$1,213,987 |
$1,001,014 |
$212,973 |
$165,075 |
|
Administration |
$876,478 |
$1,163,679 |
$(287,201) |
$119,181 |
|
R&D |
$ - |
$ - |
$ - |
0 |
|
Profit Before Taxes |
$(2,127,094) |
$(3,342,637) |
|
|
|
Variance Analysis for EI |
||||
|
|
|
|
Variances |
|
|
|
Budget |
Actual |
Spending Variance |
Volume Variance |
|
Revenue |
$11,880,000 |
$12,807,432 |
|
|
|
Cost of Sales (Variable) |
$3,300,000 |
$3,357,288 |
$(57,288) |
$(57,288) |
|
Cost of Sales (Fixed) |
$1,339,371 |
$1,076,125 |
$263,246 |
$(77,684) |
|
Gross Margin |
$7,240,628.93 |
$8,374,018.63 |
|
|
|
Less Operating Expenses |
|
|
|
|
|
Marketing |
$642,013 |
$438,986 |
$203,027 |
$(37,237) |
|
Administration |
$463,522 |
$510,321 |
$(46,799) |
$(26,884) |
|
R&D |
$1,480,000 |
$932,000 |
$548,000 |
$(85,840) |
|
Profit Before Taxes |
$4,655,094 |
$6,492,711 |
|
|
Calculated By using Standard Price * Standard Quantity) - (Actual Price * Actual Quantity)
Get instant access to this case solution for only $19
Get Instant Access to This Case Solution for Only $19
Standard Price
$25
Save $6 on your purchase
-$6
Amount to Pay
$19
Different Requirements? Order a Custom Solution
Calculate the Price
Related Case Solutions
Get More Out of This
Our essay writing services are the best in the world. If you are in search of a professional essay writer, place your order on our website.

