Get instant access to this case solution for only $19
Wilkins, A Zurn Company Demand Forecasting Case Solution
| Solution Id | Length | Case Author | Case Publisher |
|---|---|---|---|
| 1003 | 1393 Words (7 Pages) | Carol Prahinski, Eric Olsen | Ivey Publishing : 906D06 |
Wilkins Regulator Company is one of the leading companies in the market known for its production of fire valve, PVB and other segments. However, a detailed analysis of their forecast budgeting revealed that there are several issues with the implemented methods which might expose the firm to huge reputational risk and a possibility of losses. The company’s sales are dependent on several factors that are both linked to market and firm related. Unemployment rate, loan rate, prevalent weather, home construction rate, marketing of products, sales promotions etc are some of the crucial factors affecting the sales of the business.
Following questions are answered in this case study solution
-
How accurate was the demand for the first quarter of 2005?
-
What is the current demand forecast method? Who uses the demand forecast? What are the consequences, if any if the forecast is inaccurate?
-
Create a demand forecast for PVB product family for next three quarters. How does your demand forecast compare to Wilkins’s demand forecast?
-
As Bernie Barge, what would you recommend to management and why? How should Barge convince management to follow his recommendations. Develop an action plan.
Case Analysis for Wilkins, A Zurn Company Demand Forecasting
1. How accurate was the demand for the first quarter of 2005?
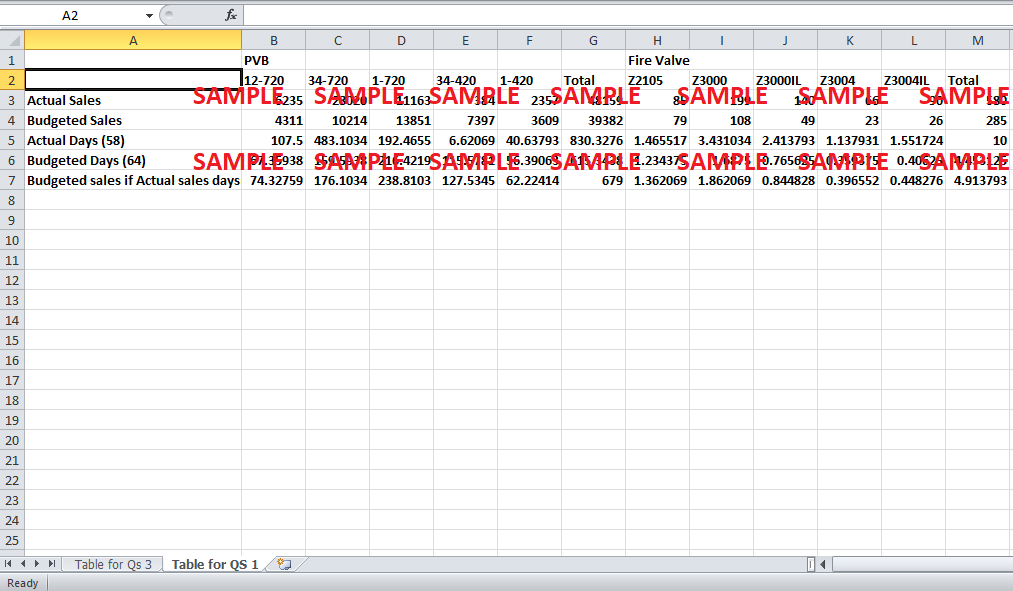
According to the data given the first quarter of 2005 starts from October 1 2004. According to exhibit 3 the first quarter had 64 planned days whereas in actuality, there were 58 days; therefore depicting that the firm had miscalculated the budget by 6 days. Therefore, this had a huge impact on all the calculations. Attached below is the table in which a comparison is made between the actual sales and the budgeted sales depending on the actual days and the budgeted days.
As the table above shows that on an overall basis the actual sales (48159) are higher as compared to budgeted sales (39382). But looking into sub products, it is evident that the planning failed by a huge margin. This is clearly evident in all segments. Overall in fire value products, the firm sold more than expected by 103%. The sales exceeded in all the products, but in PVB sector the sales mismatched in different sector lines. In some, they overly exceeded while in others, they failed to meet the budget by a huge amount. A significant overestimation was seen in the product category of 34-420 where they had budgeted sales of 7397 pieces, and in reality the firm just sold 7397 pieces thereby overestimating by 1826%. In general opinion, the demand forecast for the first quarter was not accurate at all. Therefore, the firm should implement better techniques to forecast the demand.
2. What is the current demand forecast method? Who uses the demand forecast? What are the consequences, if any if the forecast is inaccurate?
The firm uses a spreadsheet by the name of forecast master to forecast demand for the following year. This software utilizes data on industry swings, competitive techniques and historical sales figures of the company, for the past couple of years in order to predict the sales for the for coming 4 to 6 quarters. This spreadsheet lists the mean weekly sales history of all the segments both quarterly and yearly since 1999. To further enhance the predicted results, this figure can be computed for years that date back to 1989. Then in order to determine the average weekly sales of each quarter, the total quarter’s sales is divided by 13, which is the number of weeks in each quarter. After this, the forecasted demand for the next five to six quarters is plugged into the data. All this information is then used to forecast the cost and sales of each unit by which the expected gross profit per unit is attained. This demand forecast is then utilized by the account and finance to allocate budgets and resources to each segment.
The consequences for the firm can be severe if there is an inaccuracy in the forecast. At the start of each year, the firm allocates resources and procures raw materials and staff for the production. Moreover, if there is a single plant for production then it has to allocate time according to the profits and demand by the market. If the plans change then there will be time shortage, as well as, lack of resources. Furthermore, in some cases the feasibility to buy from outside is also not possible both due to lack of time and money. This all puts a huge reputational risk for the firm. Lack of sales of one product may cause storage problems, which may further add to the costs else a firm will have to see the product at a cheap rate which may cause losses etc. Therefore, the accurate budgeting is the prime duty of any firm and utmost care must be taken to predict an accurate demand forecast.
3. Create a demand forecast for PVB product family for next three quarters. How does your demand forecast compare to Wilkins’s demand forecast?
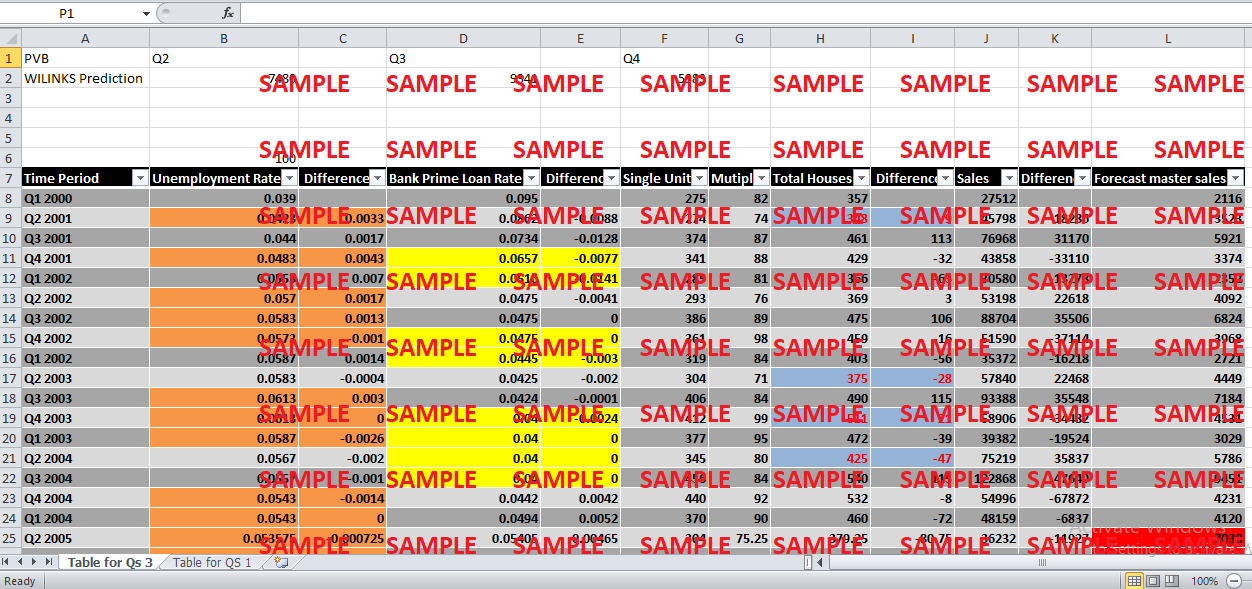
Analyzing the figures of forecasted sales along with the mortgage loans rates, unemployment rate and construction of houses revealed that there is no correlation between the unemployment rate and sales of PVB. The effect is minimal and explains very little deviation in the sales of PVB; therefore it is insignificant. On the other hand, the bank prime loan rate and house construction plays a crucial role in the demand of PVB. Moreover, since the demand of PVB is concentrated in the irrigation sector and since there is not given the data for irrigation sector; therefore, it is impossible to imply a more accurate figure in sales. According to data findings, there has been taken an average of all the quarters’ rates to forecast the loan rate of the next three quarters which gives a value of 5.41%, 5.08% and 4.94% for the three quarters respectively. Similar methodology was used to calculate the figures for house construction. It was assumed that since the weather has always played a crucial role in the construction of houses; therefore, this technique provided more accurate figures. Similarly, relationships were taken out for the unemployment rate. Taken the difference it was noted that as the rate declines the sales of PVB increases while a boom in the home construction increases the sale of PVB. Upon this measure, there has been predicted the sales of PVB which came out to be 7030, 9670 and 9782. These figures differ significantly from the predicted figures of Wilkins who quoted sales of 7480, 9341 and 5983 for the respective quarters. These values are indicative of the existing correlation between the loan rate, home construction and the PVB sales. As a great decline in the loan rate should depicts a significant increase in PVB sales but according to WILKIIINs forecasts, for the third quarter if the loan rate drops then PVB sales is also declining instead of increasing. Attached below is the calculation for forecasts. The figures highlighted are those which do not fit the forecasted trend. It is evident that the unemployment rate rarely plays any role in the forecasting of sales of PVB.
Get instant access to this case solution for only $19
Get Instant Access to This Case Solution for Only $19
Standard Price
$25
Save $6 on your purchase
-$6
Amount to Pay
$19
Different Requirements? Order a Custom Solution
Calculate the Price
Related Case Solutions
Get More Out of This
Our essay writing services are the best in the world. If you are in search of a professional essay writer, place your order on our website.

