Get instant access to this case solution for only $19
Tanpin Kanri: Retail Practice at Seven-Eleven Japan Case Solution
| Solution Id | Length | Case Author | Case Publisher |
|---|---|---|---|
| 1414 | 1396 Words (5 Pages) | Rajiv Lal, Arar Han | Harvard Business School : 506002 |
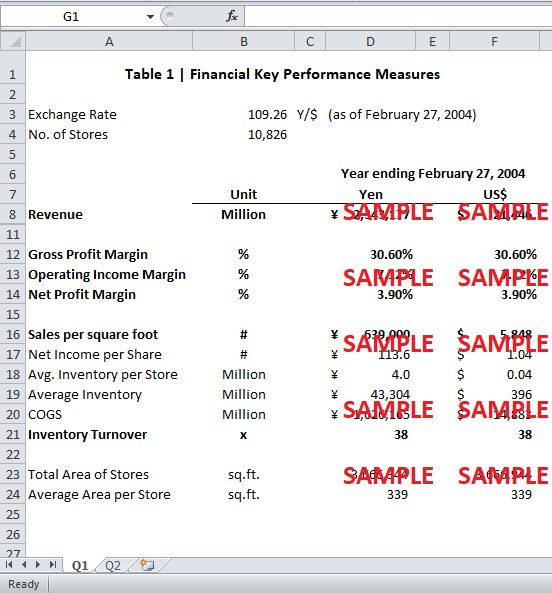
Table 1 shows the key financial measures of Seven-Eleven Japan for the fiscal year 2003 (ending 28 February, 2004). As shown in Table 1, the Japanese Yen to US Dollar exchange rate is 109.26 ¥/$. In the fiscal year 2003, the total revenue of Seven-Eleven Japan is ¥ 2,343,177 million which is equivalent to US$ 21,446. The sales per square foot is ¥ 639,000 or US$ 5,848 per square foot.
Following questions are answered in this case study solution
-
Financial Key Performance Measures
-
Marketing & SAles Expenses Analysis

Case Analysis for Tanpin Kanri: Retail Practice at Seven-Eleven Japan
Moreover, the gross margin of the company is 30.6%, as given in Exhibit 1d. The Operating Income margin is 7.12% while the net profit margin is 3.9%. The Inventory Turnover has been calculated by dividing the Cost of Goods Sold (COGS) by Average Inventory per Store. The Average Inventory per Store is worth ¥ 4 million or US$ 36,610 approximately. Since the total number of stores of Seven-Eleven Japan is 10,826, the overall average inventory for the company is ¥ 43,304 million or $ 396 million. The Cost of Goods Sold has been obtained by subtracting the gross profit from the revenue. The Inventory Turnover obtained by dividing COGS by the average inventory is 38. This implies that the inventory is purchased and sold 38 times in a year.

2. Marketing & Sales Expenses Analysis
As already mentioned, the gross profit margin of Seven-Eleven Japan is 30.6% for the fiscal year 2003 (ending 28th February, 2004). The operating expenses have been calculated by subtracting operating income from the gross profit. As the Marketing & Sales Expenses have been given to be 70% of total operating expenses, the MSE have come out to be ¥ 385,079 million or equivalently US$ 3,524 million.
Using the formulas given in the book, the Net Marketing Contribution has been obtained by subtracting the Marketing & Sales expenses from the gross profit. The Net Marketing Contribution (NMC) for Seven-Eleven Japan is ¥ 331,933 million or $ 3,038 million. Furthermore, the Marketing Return on Sales (ROS) for the company is 14.17% that is obtained by dividing the NMC by total revenue.
Similarly, Marketing ROI, calculated by dividing the NMC by the marketing and sales expenses (MSE), for the company is 86.2%. The Marketing ROS of Apple is 27.4% while the Marketing ROI of Apple is 323%. Marketing ROS signifies the percentage of Marketing Return on Investment (ROI) represents the return on each dollar invested in marketing and sales. The Marketing ROI of Seven-Eleven Japan is much lower as compared to that of Apple. A dollar invested in marketing and sales activities brought only $ 0.86 for Seven-Eleven Japan as compared to $ 323 in the case of Apple. This clearly shows that the marketing and sales activities are incurring a loss.

3. Retail management at Seven-Eleven Japan, using Tanpin Kanri, is slightly different from the normal industry practice. Most of the supply chain networks implement automatic replenishment system to replace the inventory that has been sold out, using the point-of-sale (POS) data. Normatively, the items that have sold well in past are ordered in higher quantities. Contrary to this, the replenishment system used in Tanpin Kanri involves other factors in addition to past data in order to gauge the future demand. The employees obtain POS data and incorporate other factors to determine the future demand of a product. As evident, while both use POS data in their inventory replenishment systems, the key difference is that Tanpin Kanri has a forward-looking approach when ordering inventory while other stores rely on past trends only. Moreover, Tanpin Kanri has a manual process of ordering inventory involving human judgement of local employees as opposed to an automated system used by other stores. Another important difference in the Tanpin Kanri system is that POS data is used to identify and eliminate shelf warmers rather than items that sold well.
4. The term “hypothesis” implies “expected demand” according to the judgement of certain local employees. The store employee take the POS data and incorporates other factors that might affect demand to estimate the demand of a certain product. Based on this analysis, the employee will theorize a certain level of demand for each product and whether or not a certain product will sell. This theory or estimate is called hypothesis as this is only their expectation/belief which is yet to be tested.
The retail store employees are responsible for “hypothesizing.” It is their responsibility to understand what might affect demand and observe such factors over time such as consumer activities and purchase behavior, in order to improve the sales activities as well as derive demand.
Get instant access to this case solution for only $19
Get Instant Access to This Case Solution for Only $19
Standard Price
$25
Save $6 on your purchase
-$6
Amount to Pay
$19
Different Requirements? Order a Custom Solution
Calculate the Price
Related Case Solutions
Get More Out of This
Our essay writing services are the best in the world. If you are in search of a professional essay writer, place your order on our website.

