Get instant access to this case solution for only $19
Bridgeton Industries: Automotive Component & Fabrication Plant Case Solution
| Solution Id | Length | Case Author | Case Publisher |
|---|---|---|---|
| 575 | 1980 Words (8 Pages) | Robin Cooper, Patricia J. Bost | Harvard Business School : 190085 |
The original manufacturing site for Bridgeton Industries, Automotive Component and Fabrication Plant, ACF was a leading supplier of components for domestic automobile manufacturers. In the beginning of the operation, the company had competition with local suppliers and other Bridgeton plants. Later, expensive gasoline and entry of foreign competitors into the market caused trouble for ACF in retaining their market share. The major reason for losing market share was the production of high cost automobile components. Company hired a strategic consulting firm to analyze the costing strategy. The forecasted unit cost estimated for the model year 1987 includes direct materials cost per unit, direct labor cost per unit, and overhead as a percentage of direct labor, i.e. 435 (%). The products are classified into three classes on the basis of cost competitiveness. The distinction of products in this degree helps the company to decide whether a certain product or outsourced by the company.
Following questions are answered in this case study solution:
-
The overhead allocation rate used in the 1987 model year strategy study at the Automotive Component & Fabrication Plant (ACF) was 435% of direct labor dollar cost. Calculate the overhead allocation rate using the 1987 model year budget. Calculate the overhead allocation rate for each of the model years 1988 through 1990. Are the changes since 1987 in overhead allocation rates significant? Why have these changes occurred?
-
Calculate the expected gross margins as a percentage of selling price on each product based on the 1988 and 1990 model year budgets, assuming selling price and material and labor cost do not change from standard.
-
Are the product costs reported by the cost system appropriate for use in the strategic analysis?
-
Assume that the selling prices, volumes, and material costs for the 1991 model year will not change for fuel tanks and doors produced by the ACF of Bridgeton Industries. Assume also that if manifolds are produced, their selling prices, volume, and material costs will not change either.
-
Assume you have been hired as a consultant by Bridgeton Industries to advise the company as to whether or not the company should outsource manifolds. Would you outsource manifolds from the ACF in 1991? Why, or why not? What more information would you want before reaching a final decision?
Bridgeton Industries Automotive Component Fabrication Plant Case Analysis
1. The overhead allocation rate used in the 1987 model year strategy study at the Automotive Component & Fabrication Plant (ACF) was 435% of direct labor dollar cost. Calculate the overhead allocation rate using the 1987 model year budget. Calculate the overhead allocation rate for each of the model years 1988 through 1990. Are the changes since 1987 in overhead allocation rates significant? Why have these changes occurred?
The overhead allocation rate is the percentage of direct labor cost budgeted in the model year. It can be calculated using this formula:
Overhead Allocation Rate = Total Overhead Cost / Direct Labor Cost
Using this formula, the overhead allocation rate for 1987 model year is calculated first. The rate is calculated to be 437% of direct labor cost. In a similar way, the overhead allocation rate is also calculated for each of the model years 1998 through 1990. The overhead rates of the years, 1989 and 1990, are significantly different from the overhead rate of 1987. A table is given below showing the overhead allocation rates from the year 1987 to 1990.
|
|
1987 |
1988 |
1989 |
1990 |
|
Overhead Allocation Rate |
437% |
434% |
577% |
563% |
This table shows a large difference between overhead rate in the year 1988 and 1989. The overhead rate in year 1989 and year 1990 are significantly high than the overhead rate in 1988. There are multiple reasons of this increase in overhead rate.
-
Dropping of two product lines, Muffler and Oil Pans.
-
The percentage decrease in direct labor is greater than percentage decrease in overhead.
-
The percentage share of direct labor of two product lines in total direct labor is more than their percentage of share of overhead costs in total overhead costs.
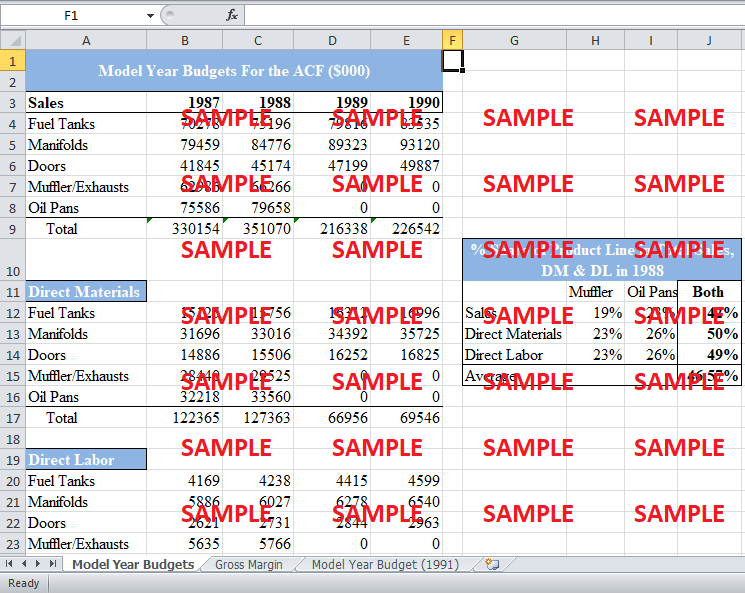
According to the classification of products, the products of the third class are less cost competitive. Hence, company decides to outsource these products rather than to produce it. In turn, the direct labor cost, as it can be directly traceable to products, sharply decline. While, the overhead costs did not decline too much relative to the decline in direct labor. Moreover, Muffler and Oil Pans constitute 49% of the total direct labor cost; therefore, the percentage decrease in direct labor cost in 1989 is around 49%, i.e. 46.48%. However, the percentage decrease in overhead cost, after dropping the two product lines, is 29%. The difference in percentage decrease results in higher overhead allocation rate, in the year 1989. The table below shows the proportion of Muffler and Oil spans in the total sales, direct materials and direct labor cost.
|
% Share of Product Line in Total Sales, DM & DL in 1988 |
|||
|
|
Muffler |
Oil Pans |
Both |
|
Sales |
19% |
23% |
42% |
|
Direct Materials |
23% |
26% |
50% |
|
Direct Labor |
23% |
26% |
49% |
|
Average |
|
|
46.57% |
Consider two products in the same product line
|
|
Product 1 |
Product 2 |
|
Expected Selling Price |
$62 |
$54 |
|
Standard Material Cost |
$16 |
$27 |
|
Standard Labor Cost |
$6 |
$3 |
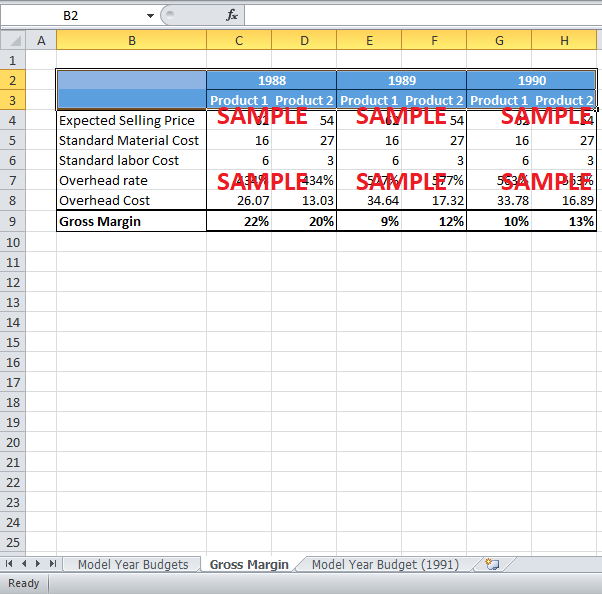
2. Calculate the expected gross margins as a percentage of selling price on each product based on the 1988 and 1990 model year budgets, assuming selling price and material and labor cost do not change from standard.
The expected gross margins as a percentage of the selling price on each product are calculated on the basis 1988 to 1990 year budgets. The formula used for the calculation of expected gross margin is:
Gross Margin = (Sales – Cost of Goods Sold) / Sales
Given selling price is used to calculate gross margin of products in different years. The cost of products includes the cost of material, labor and overhead costs. The costs of material and labor are given. The overhead cost of the product in the specific year is calculated using the overhead allocation rate relevant to that model year. As the overhead allocation rate of the model year 1990 significantly exceeds the overhead rate of 1988, the budgeted overhead costs of the products in 1990 rose significantly as compared to the overhead costs of other year. Therefore, the expected gross margin as a percentage of the selling price of the products produced in 1990 is lower than the products produced in 1988. The table, given below, shows the gross margin of the product 1 and product 2 in each of the model year from 1988 to 1990.
|
|
1988 |
1989 |
1990 |
|||
|
|
Product 1 |
Product 2 |
Product 1 |
Product 2 |
Product 1 |
Product 2 |
|
Expected Selling Price |
62 |
54 |
62 |
54 |
62 |
54 |
|
Standard Material Cost |
16 |
27 |
16 |
27 |
16 |
27 |
|
Standard labor Cost |
6 |
3 |
6 |
3 |
6 |
3 |
|
Overhead rate |
434% |
434% |
577% |
577% |
563% |
563% |
|
Overhead Cost |
26.07 |
13.03 |
34.64 |
17.32 |
33.78 |
16.89 |
|
Gross Margin |
22% |
20% |
9% |
12% |
10% |
13% |
3. Are the product costs reported by the cost system appropriate for use in the strategic analysis?
The product cost reported by the cost system does not seem to be appropriate for strategic analysis. This product costing system is overvaluing the product cost, in turn decreasing the cost competitiveness of the products. Hence, this product costing system would suggest outsourcing the products, which are profitable for the company. The outsourcing would further take out the products from cost competitive pool and made them high cost products, by allocating a large chunk of overhead costs in their manufacturing costs.
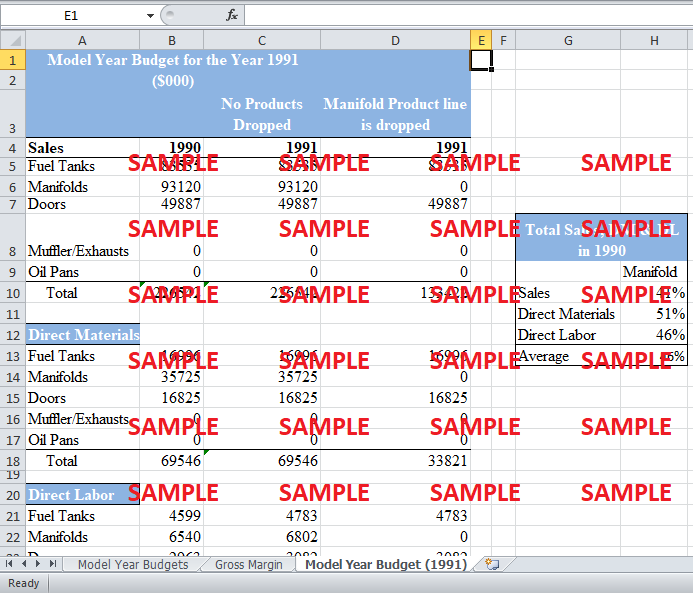
4. Assume that the selling prices, volumes, and material costs for the 1991 model year will not change for fuel tanks and doors produced by the ACF of Bridgeton Industries. Assume also that if manifolds are produced, their selling prices, volume, and material costs will not change either.
a. Prepare an estimated model year budget for the ACF in 1991
If no additional products are dropped;
The budget for the ACF in model year 1991 is estimated. The total sales, direct labor and direct materials costs remain same as of the year 1990. Following are the assumptions are taken in estimating the budgeted model.
-
The product lines of ACF remain same that are fuel tanks, manifolds and doors.
-
The selling prices, volume and material costs are not changed.
If the manifold product line is dropped;
Similarly, the budget for ACF in model year 1991 is also estimated with little changes in assumptions. Following are the assumptions:
-
One of three product lines dropped, i.e. Manifolds
-
The selling prices, volume, and material costs of fuel tanks and doors do not change.
b. Explain any additional assumptions you make in preparing your estimated model year budgets.
Additional assumptions are also made while preparing the estimated model year budgets. As the assumptions about sales prices, volume and material costs, are given, the assumption about the direct labor costs and the overhead costs are made.
The direct labor costs are increased in both the models by 4% of the preceding year direct labor costs. This assumption is made on the basis of the increase in direct labor costs in years from 1987 to 1990.
Similarly, the increase in the overhead costs in the model year budget estimation when there is no product is dropped; overhead costs are increased in the year 1991 on the basis of percentage change in overhead from 1989 to 1990.
However, the percentage increase in the overhead costs in the model year budget estimation when product line of manifolds is dropped, overhead costs are increased in the year 1991 on the basis of percentage change in overhead from 1988 to 1989. The rationale behind this assumption is that in the year 1989 the dropping in the two product lines approximately decrease the sales, materials and labor cost at a same average rate as the decrease in sales, materials and labor cost after the dropping of manifolds.
|
% Share of Product Line in Total Sales, DM & DL in 1988 |
|||
|
|
Muffler |
Oil Pans |
Both |
|
Sales |
19% |
23% |
42% |
|
Direct Materials |
23% |
26% |
50% |
|
Direct Labor |
23% |
26% |
49% |
|
Average |
|
|
46.57% |
|
% Share of Manifold in Total Sales, DM & DL in 1990 |
|
|
|
Manifold |
|
Sales |
41% |
|
Direct Materials |
51% |
|
Direct Labor |
46% |
|
Average |
46% |
The table shows the average percentage share of two products lines, muffler and Oil pans, and manifolds in sales, direct material and direct labor. As the average proportion is quite similar, it is assumed that dropping either two product lines or manifolds will generate same affect in overhead costs.
c. What will be the overhead allocation rate under the two scenarios?
|
` |
1990 |
No Product is Dropped |
Manifold Product line is dropped |
|
Overhead Allocation Rate |
563% |
572% |
729% |
The table shows that overhead allocation rate under two scenarios, when no product is dropped and when only one product, manifolds, is dropped. There is high increase in overhead allocation rate due to a high percentage decrease in direct labor relative to manufacturing overhead.
Get instant access to this case solution for only $19
Get Instant Access to This Case Solution for Only $19
Standard Price
$25
Save $6 on your purchase
-$6
Amount to Pay
$19
Different Requirements? Order a Custom Solution
Calculate the Price
Related Case Solutions
- BRL Hardy Globalizing an Australian Wine Company Case Solution
- Buffalo Wild Wings, Inc. Strategic Plan Case Solution
- Building the Culture at Agilent Technologies Back to the Future Case Solution
- Bunge Poised for Growth Case Solution
- Burlington Northern Railroad Company: Equipment Leasing Case Solution
Get More Out of This
Our essay writing services are the best in the world. If you are in search of a professional essay writer, place your order on our website.

