Get instant access to this case solution for only $15
Sprigg Lane (A) Case Solution
| Solution Id | Length | Case Author | Case Publisher |
|---|---|---|---|
| 1400 | 1013 Words (7 Pages) | Samuel E Bodily, Larry Weatherford | Darden School of Business : UV6136 |
Tom Dingledine, the president of Sprigg Lane Natural Resources (SLNR) is facing a decision to invest in the Bailey Prospect natural gas opportunity. It is an opportunity to invest in a package of 20 wells altogether. SLNR is a subsidiary of Sprigg Lane Investment Corporation (SLIC). SLIC entered into natural gas by drilling four wells in 1987. The general investment strategy of Dingledine has been to invest at locations where the new well will already be surrounded by other wells. Moreover, for drilling each well, SLNR would approach other investors and retain only 25% of share. For the current project, Dingledine has conducted NPV analysis for a single well that characterizes the Bailey Project, however, there are some uncertainties involved in the analysis. This report has conducted a Monte-Carlo Simulation using the uncertainties pertaining to six different inputs.
Following questions are answered in this case study solution
-
Does each of these scenarios meet the three investment criteria Dingledine uses?
-
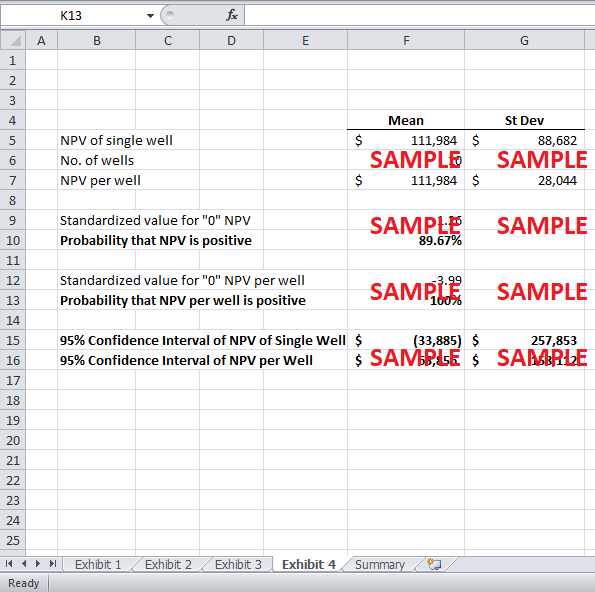
What is the probability that the NPV will be greater than zero?
-
What is the probability that the NPV per well will be greater than zero?
Case Analysis for Sprigg Lane (A)
1. Does each of these scenarios meet the three investment criteria Dingledine uses?
Dingledine has prepared NPV analysis for three different scenarios for a single well, i.e. Most Likely or Base Case, Case with No Gas Production and a Worst Case. Moreover, Dingledine uses the following three criteria to determine if a well is good enough to drill.
-
Payback should be smaller than 42 months
-
After-Tax Internal Rate of Return should be greater than 25%
-
Before –Tax Internal Rate of Return should be greater than 15%
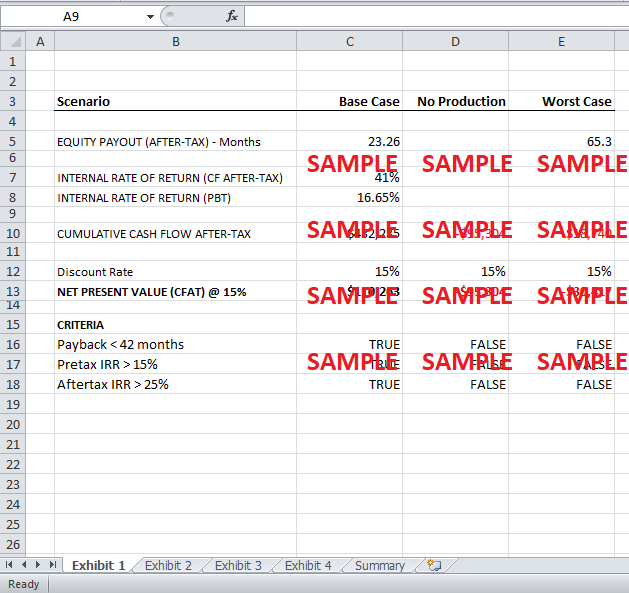
Out of the three scenarios built by Dingledine, only the base case meets all of the investment criteria. The case with no production, of course, does not pay anything back while the worst case has a payback of 65.3 months. Furthermore, the NPV of both the pessimistic cases is negative and the IRR cannot be calculated as there are no positive cash flows. Exhibit 1 shows a summary of the three scenarios.
Exhibit 1: Dingledine’s Three Investment Criteria
|
|
|||
|
Scenario |
Base Case |
No Production |
Worst Case |
|
|
|
|
|
|
EQUITY PAYOUT (AFTER-TAX) - Months |
23.26 |
|
65.3 |
|
|
|
|
|
|
INTERNAL RATE OF RETURN (CF AFTER-TAX) |
41% |
|
|
|
INTERNAL RATE OF RETURN (PBT) |
16.65% |
|
|
|
|
|
|
|
|
CUMULATIVE CASH FLOW AFTER-TAX |
$432,235 |
-$95,304 |
-$18,740 |
|
|
|
|
|
|
Discount Rate |
15% |
15% |
15% |
|
NET PRESENT VALUE (CFAT) @ 15% |
$110,263 |
-$95,304 |
-$30,417 |
|
|
|
|
|
|
CRITERIA |
|
|
|
|
Payback < 42 months |
TRUE |
FALSE |
FALSE |
|
Pretax IRR > 15% |
TRUE |
FALSE |
FALSE |
|
After-tax IRR > 25% |
TRUE |
FALSE |
FALSE |
2. What is the probability that the NPV will be greater than zero?
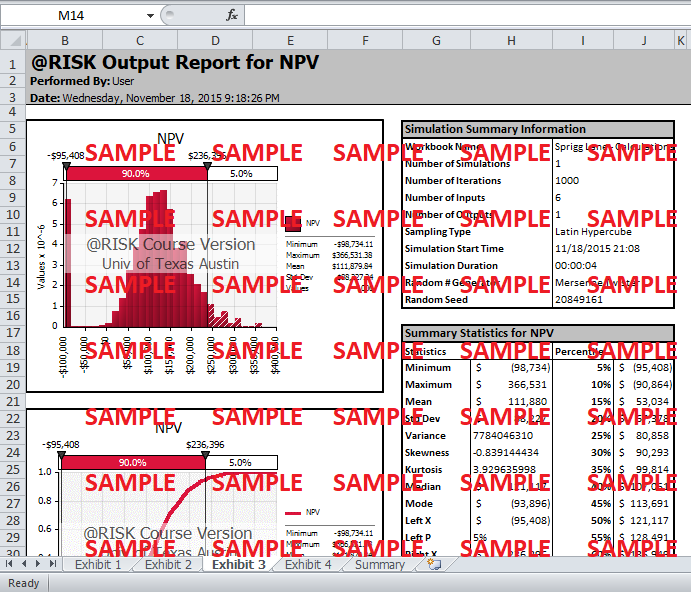
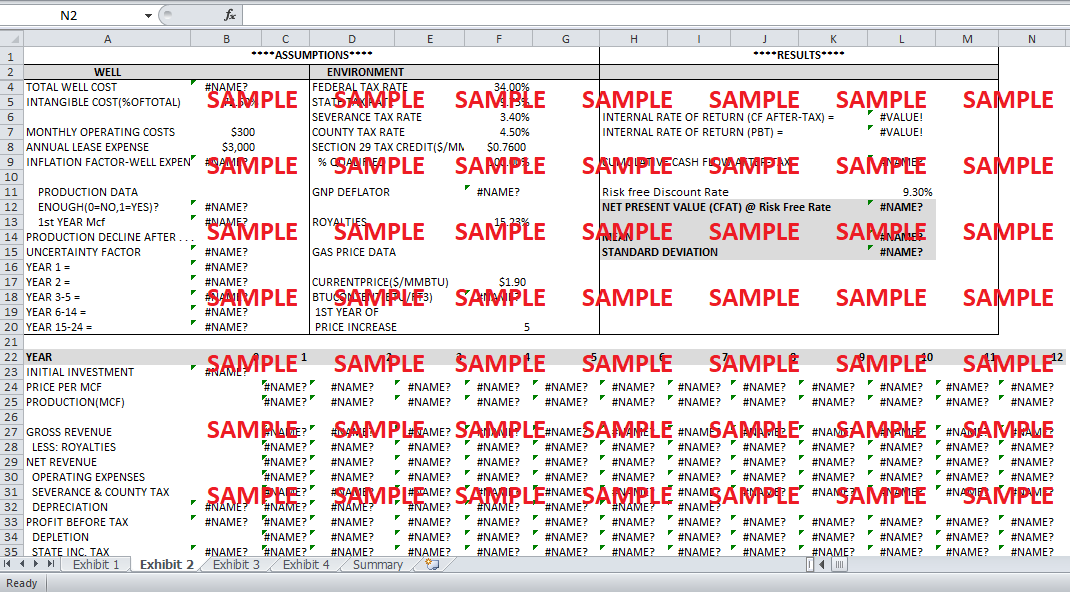
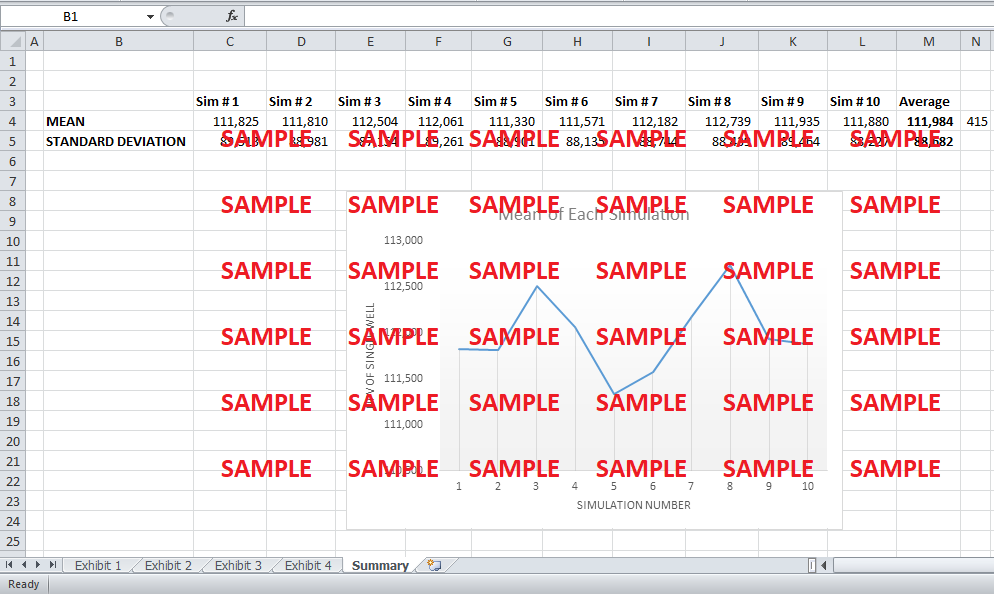
However, in order to identify the risk involved in the base case, it is essential to incorporate the uncertain distributions of each input. A Monte-Carlo Simulation has been conducted to get a probability distribution for the NPV of a single well. There are following six different uncertainties in the NPV calculation.
-
There is a 90 percent chance that there will be gas in the well and 10 percent chance of failure.
-
The amount of gas production in the first year follows a lognormal distribution with a mean of 33,000 mcf and standard deviation of 4,930 mcf.
-
The total well cost follows a normal distribution with a mean of 160K and standard deviation of 2,700.
-
The BTU content follows a triangular distribution with low value of 1,055, most likely value of 1,160, and high value of 1,250.
-
The production decline rates follow a triangular distribution with the rates in the base case being the most likely values. In comparison of the most likely rates being 1.0, a high value of 1.75 and low value of 0.5 has been assumed. In order to accommodate this distribution, a distribution factor has been obtained by entering the triangular distribution in a cell and multiplying the value generated by each of the production decline rates in the base case.
-
The inflation rate follows a normal distribution with a mean of 3.73 percent (average forecast) and a standard deviation of 0.46 percent (historical).
Moreover, a risk free discount rate of 9.3% has been used since risk has been incorporated through the simulation.
Get instant access to this case solution for only $15
Get Instant Access to This Case Solution for Only $15
Standard Price
$25
Save $10 on your purchase
-$10
Amount to Pay
$15
Different Requirements? Order a Custom Solution
Calculate the Price
Related Case Solutions
Get More Out of This
Our essay writing services are the best in the world. If you are in search of a professional essay writer, place your order on our website.

