Get instant access to this case solution for only $19
Brazos Partners: The CoMark LBO Case Solution
| Solution Id | Length | Case Author | Case Publisher |
|---|---|---|---|
| 571 | 1464 Words (7 Pages) | Josh Lerner, G. Felda Hardymon, Ann Leamon | Harvard Business School : 202090 |
In order to find out whether this deal is lucrative and feasible for Brazos, you need to carry out a valuation analysis for the company. However, even before carrying out the relevant analysis, one should dig deeper into the LBO and find out whether this deal is good for Brazos from a non financial perspective. Firstly, this investment is attractive for Brazos because the target firm fits the investment strategy criteria. Secondly, the business is in a growing phase, and at the same time the business processes employed at CoMark are efficient and cost effective in comparison to the rest of the industry. Thirdly, the management of the target firm is good and up to the mark of providing the required boost to the company. At the same time, Brazos’s owners have a good match of philosophy with that of CoMark’s owners. Fourthly, the business is somehow recession resistant. Apart from this resistance, a larger portion of the target firm’s business is carried out with government which in turn makes the cash flow streams more stable and unwavering. All these characteristics point out that CoMark is feasible LBO target.
Following questions are answered in this case study solution
-
At $40 million, is this a good deal for Brazos. If so how much do you project that CoMark is really worth? What is the projected return for Brazos with a 5 year exit?
-
The seller wants to sell shares; the buyer wants to purchase the assets. Why is this case for each party? What can you (“Brazos”) put in front of the sellers (“Vendors”) to convince them to take a tax hit now? What if anything makes it possible to convince them?
-
What are some non-financial issues that you see in this case that may limit the ultimate returns? How do you price that (or valuate) that?
Case Analysis for Brazos Partners: The CoMark LBO
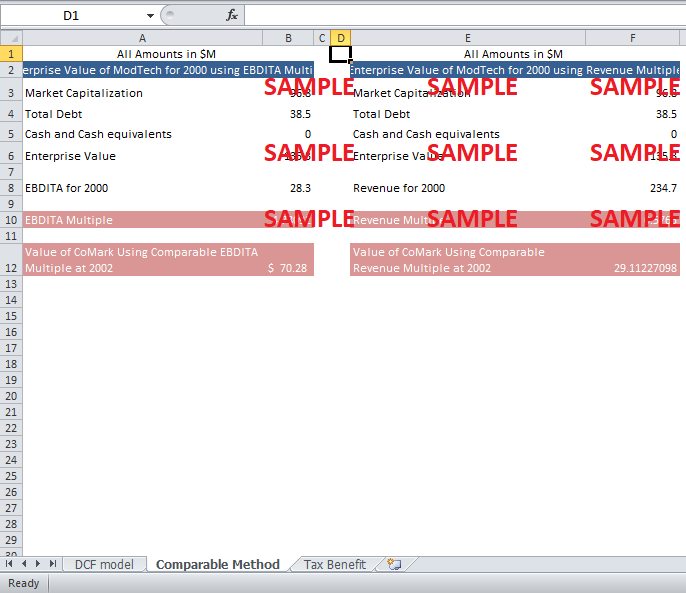
Two types of valuations, namely the DCF and comparable analysis, can be carried out in order to find out the value of CoMark. Let's first move onto the comparable company valuation method. CoMark was a unique company in terms of its business segment and geographical distribution. Among the list of all the available companies, only one company, ModTech Holdings, Inc is a good match. Apart from its large size, the business process and target market of both the firms are quite alike. Also, as limited data is available for CoMark, therefore, only EBDITA and revenue multiple valuations can be carried out.The following table depicts the relevant calculations pertaining to the EBDITA multiple.
Table 1: Enterprise Value of CoMark for 2000 using EBDITA Multiple
|
All Amounts in $M |
|
|
Enterprise Value of CoMark for 2000 using EBDITA Multiple |
|
|
Market Capitalization |
96.8 |
|
Total Debt |
38.5 |
|
Cash and Cash equivalents |
0 |
|
Enterprise Value |
135.3 |
|
|
|
|
EBDITA for 2000 |
28.3 |
|
|
|
|
EBDITA Multiple |
4.780919 |
|
|
|
|
Value of CoMark Using Comparable EBDITA Multiple at 2002 |
$ 70.28 |
The EBDITA multiple comes out to be 4.78X. The EBDITA multiple shows that CoMark is worth $70.28 million. AS there is no explicit information on cash and cash equivalents, therefore, they are assumed to be zero.
The flowing table shows the relevant calculations pertaining to revenue multiple.
Table 2: Enterprise Value of CoMark for 2000 using Revenue Multiple
|
All Amounts in $M |
|
|
Enterprise Value of CoMark for 2000 using Revenue Multiple |
|
|
Market Capitalization |
96.8 |
|
Total Debt |
38.5 |
|
Cash and Cash equivalents |
0 |
|
Enterprise Value |
135.3 |
|
|
|
|
Revenue for 2000 |
234.7 |
|
|
|
|
Revenue Multiple |
0.5765 |
|
|
|
|
Value of CoMark Using Comparable Revenue Multiple at 2002 |
29.11227098 |
The revenue multiple comes out to be 0.57, and the consequent enterprise value for CoMark is $28.1 million. There is a huge difference between the EV of both methods. This is partly due to the fact that ModTEch Holdings Inc is a large company with enormous EBDITA and revenue.
After valuing the company by using comparables, let’s employ discounted cash flow analysis and find out the enterprise value.
For calculation of WACC, both the rates for debt and equity are calculated. As the capital structure of the firm is changing every year, so the WACC and cost of debt should also adjust their values in relation to this change. The cost of debt is calculated by utilizing the rationale depicted in the following table.
Table 3: Cost of debt
|
Cost of debt |
|||||
|
|
2002 |
2003 |
2004 |
2005 |
2006 |
|
Bank loan |
10.6 |
4 |
0 |
0 |
0 |
|
Seller Note |
9.7 |
10.5 |
11.3 |
12.2 |
13.2 |
|
Bank loan rate |
6.25% |
6.25% |
6.25% |
6.25% |
6.25% |
|
Seller Note rate |
8% |
8% |
8% |
8% |
8% |
|
Bank loan Weightage |
52% |
28% |
0% |
0% |
0% |
|
Seller Note Weightage |
48% |
72% |
100% |
100% |
100% |
|
Weighted average Cost of Debt |
7.09% |
7.52% |
8.00% |
8.00% |
8.00% |
Cost of equity is calculated by using the formula,
Cost of Equity = Risk free rate + β ( risk premium)
Risk free rate is 4.65% while the risk premium is 7%. Beta is taken to be 0.93, which is equal to the beta of comparable company, ModTech Holdings Inc. The cost of equity comes out to be 11.16%.
WACC calculations are depicted in the following table.
Table 4: WACC Calculations
|
WACC Calculations |
|||||
|
|
2002 |
2003 |
2004 |
2005 |
2006 |
|
Weightage of Debt |
47.43% |
31.80% |
21.69% |
19.18% |
17.37% |
|
Weightage of Equity |
52.57% |
68.20% |
78.31% |
80.82% |
82.63% |
|
Rate of Debt |
7.09% |
7.52% |
8.00% |
8.00% |
8.00% |
|
Rate of equity |
11.16% |
11.16% |
11.16% |
11.16% |
11.16% |
|
WACC |
9.23% |
10.00% |
10.47% |
10.55% |
10.61% |
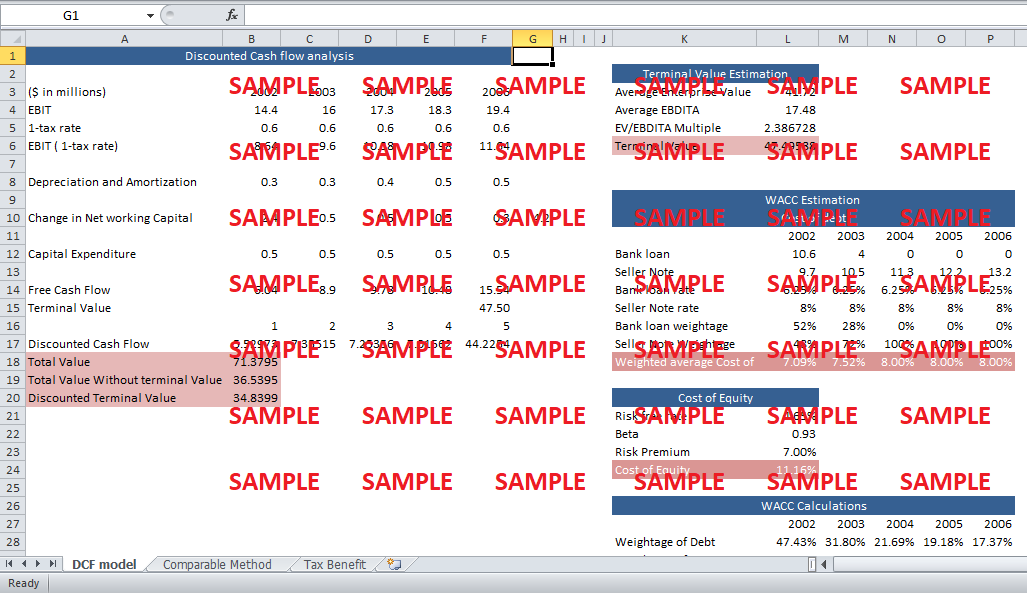
The following table shows the relevant cash flow and enterprise value calculations.
Table 5: Discounted Cash flow analysis
|
Discounted Cash flow analysis |
|||||
|
|
|
|
|
|
|
|
($ in millions) |
2002 |
2003 |
2004 |
2005 |
2006 |
|
EBIT |
14.4 |
16 |
17.3 |
18.3 |
19.4 |
|
1-tax rate |
0.6 |
0.6 |
0.6 |
0.6 |
0.6 |
|
EBIT ( 1-tax rate) |
8.64 |
9.6 |
10.38 |
10.98 |
11.64 |
|
|
|
|
|
|
|
|
Depreciation and Amortization |
0.3 |
0.3 |
0.4 |
0.5 |
0.5 |
|
|
|
|
|
|
|
|
Change in Net working Capital |
2.4 |
0.5 |
0.5 |
0.5 |
0.3 |
|
|
|
|
|
|
|
|
Capital Expenditure |
0.5 |
0.5 |
0.5 |
0.5 |
0.5 |
|
|
|
|
|
|
|
|
Free Cash Flow |
6.04 |
8.9 |
9.78 |
10.48 |
15.54 |
|
Terminal Value |
|
|
|
|
47.50 |
|
|
1 |
2 |
3 |
4 |
5 |
|
Discounted Cash Flow |
5.529728 |
7.355149 |
7.253561 |
7.015619 |
44.22542 |
|
Total Value |
71.37948 |
|
|
|
|
|
Total Value Without terminal Value |
36.53953 |
|
|
|
|
|
Discounted Terminal Value |
34.83995 |
|
|
|
|
Terminal value is calculated using the method of EBDITA exit multiple.
Table 6: Terminal Value Estimation
|
Terminal Value Estimation |
|
|
Average Enterprise Value |
41.72 |
|
Average EBDITA |
17.48 |
|
EV/EBDITA Multiple |
2.3867277 |
|
Terminal Value |
47.495881 |
The enterprise value comes out to be $71 million. ROI is calculated by two methods and is depicted as follows.
Table 7: Return on Investment
|
Return on Investment |
|
|
EBDITA Method |
|
|
Average EBDITA |
17.48 |
|
AVERAGE Enterprise Value |
41.72 |
|
Average ROI |
41.9% |
|
2nd Method |
|
|
Total Value |
71.38 |
|
Brazos Portion |
52.11 |
|
Total Investment |
40 |
|
ROI |
30.27% |
2. The seller wants to sell shares; the buyer wants to purchase the assets. Why is this case for each party? What can you (“Brazos”) put in front of the sellers (“Vendors”) to convince them to take a tax hit now? What if anything makes it possible to convince them?
Get instant access to this case solution for only $19
Get Instant Access to This Case Solution for Only $19
Standard Price
$25
Save $6 on your purchase
-$6
Amount to Pay
$19
Different Requirements? Order a Custom Solution
Calculate the Price
Related Case Solutions
Get More Out of This
Our essay writing services are the best in the world. If you are in search of a professional essay writer, place your order on our website.

