Get instant access to this case solution for only $19
Columbia Alloys Case Solution
| Solution Id | Length | Case Author | Case Publisher |
|---|---|---|---|
| 2250 | 2038 Words (14 Pages) |
This report is an analysis of two proposed growth strategies for Columbia Alloys using the methods of cash flow projections and cost of Capital valuation. The first part will deal with projected cash flows and IRR for both strategies while the second part will use the cost of capital approach with the help of some assumptions.
Following questions are answered in this case study solution
-
Introduction
-
Part 1: Internal Rate of Return
-
Part 2: Cost of Capital
-
Final Recommendation
Case Analysis for Columbia Alloys
2. Part 1: Internal Rate of Return
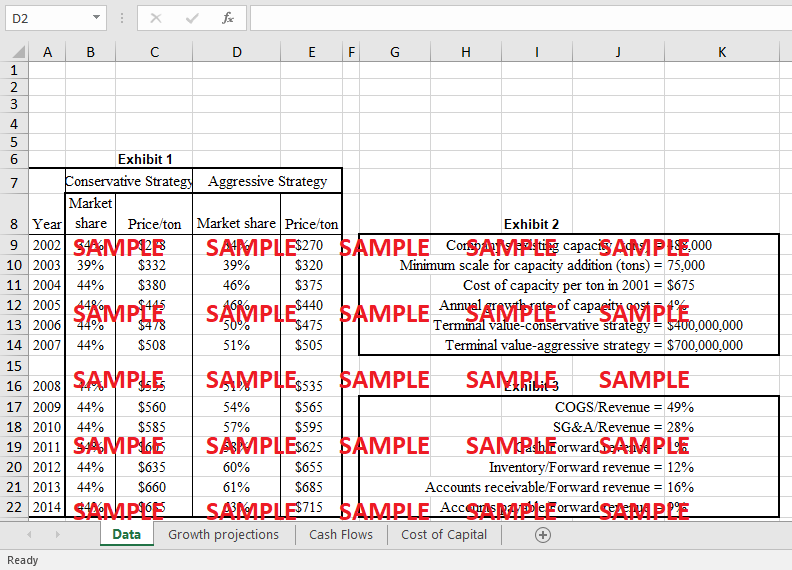
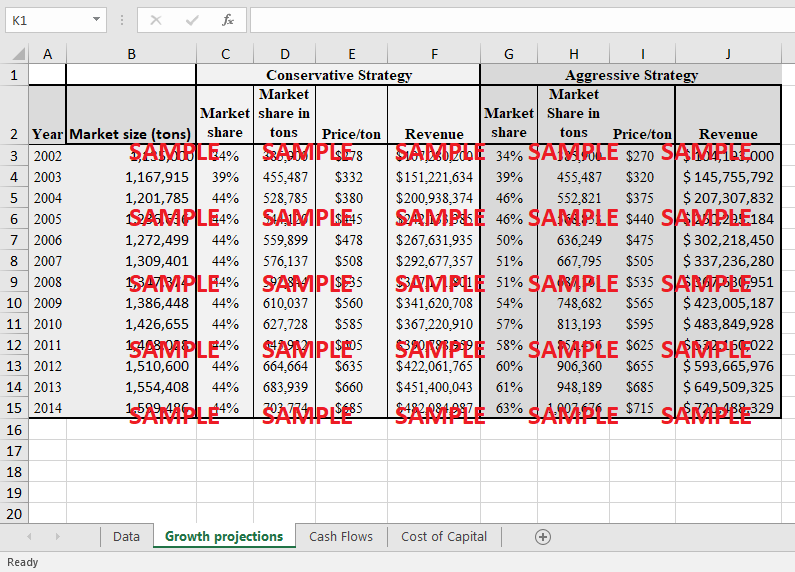
Among the two strategies, there are certain similarities that need to be considered. First of all market projections in both cases would remain the same although the market share of the company would be different in both with incremental growth and so is the revenue. Detailed analysis is presented in Exhibit 1 which shows that in the long run aggressive strategy would yield greater market share. The benefits of adopting an aggressive strategy would be increased market competition that would ultimately lead to greater profitability and market share from the competitors. The debt of the competitor’s balance sheet would limit their capacity to either expand rapidly or compete in terms of pricing and give Columbia alloys a chance to build loyal partnerships with customers which can lead to customer retention in the long run.
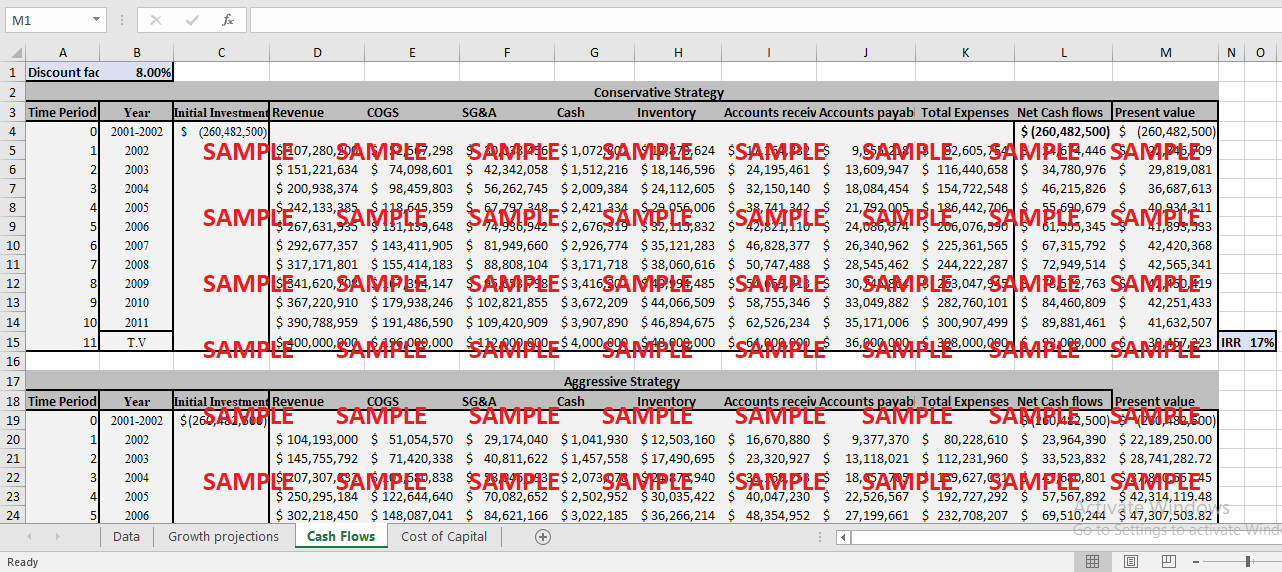
For the sake of calculations, cash projections are made for both cases. As mentioned in the case the terminal values for conservative and aggressive strategy were 400,000,000 and 700,000,000 respectively. Based on this assumption and our projections the terminal value in the case of the conservative strategy was achieved at 11 years while in the case of aggressive strategy it was achieved in 13 years so the projections for internal return have been made accordingly (Exhibit 2). The internal rate of return in the case of the conservative strategy was found to be 17% and in the case of aggressive strategy, it was 22%.
i. Conservative Strategy
|
Net Cashflows |
Present value |
|
|
|
$ (260,482,500) |
$ (260,482,500) |
|
|
|
$ 24,674,446 |
$ 22,846,709 |
|
|
|
$ 34,780,976 |
$ 29,819,081 |
|
|
|
$ 46,215,826 |
$ 36,687,613 |
|
|
|
$ 55,690,679 |
$ 40,934,311 |
|
|
|
$ 61,555,345 |
$ 41,893,533 |
|
|
|
$ 67,315,792 |
$ 42,420,368 |
|
|
|
$ 72,949,514 |
$ 42,565,341 |
|
|
|
$ 78,572,763 |
$ 42,450,419 |
|
|
|
$ 84,460,809 |
$ 42,251,433 |
|
|
|
$ 89,881,461 |
$ 41,632,507 |
|
|
|
$ 92,000,000 |
$ 39,457,223 |
IRR |
17% |
ii. Aggressive Strategy
|
Net Cashflows |
Present value |
|
|
|
$ (260,482,500) |
$ (260,482,500) |
|
|
|
$ 23,964,390 |
$ 22,189,250.00 |
|
|
|
$ 33,523,832 |
$ 28,741,282.72 |
|
|
|
$ 47,680,801 |
$ 37,850,557.45 |
|
|
|
$ 57,567,892 |
$ 42,314,119.48 |
|
|
|
$ 69,510,244 |
$ 47,307,503.82 |
|
|
|
$ 77,564,344 |
$ 48,878,693.92 |
|
|
|
$ 84,555,119 |
$ 49,337,099.71 |
|
|
|
$ 97,291,193 |
$ 52,563,404.28 |
|
|
|
$ 111,285,484 |
$ 55,670,448.18 |
|
|
|
$ 122,396,805 |
$ 56,693,403.04 |
|
|
|
$ 136,543,174 |
$ 58,561,027.10 |
|
|
|
$ 149,387,145 |
$ 59,323,690.52 |
|
|
|
$ 161,000,000 |
$ 59,199,365.87 |
|
|
|
|
|
IRR |
22% |
For the sake of analysis, the discount rate was assumed to be 8% which was higher than the risk-free rate of 6.5% as mentioned in the case. The IRR method implies that an aggressive strategy has a higher rate of return as compared to the conservative one. Based on this analysis the aggressive strategy is more favored as the opportunities with a higher internal rate of return are considered more attractive (Gallo, 2016). The aggressive strategy has higher growth rates in terms of market share and revenue projections even if measured for the same time periods (Exhibit 2).
3. Part 2: Cost of Capital
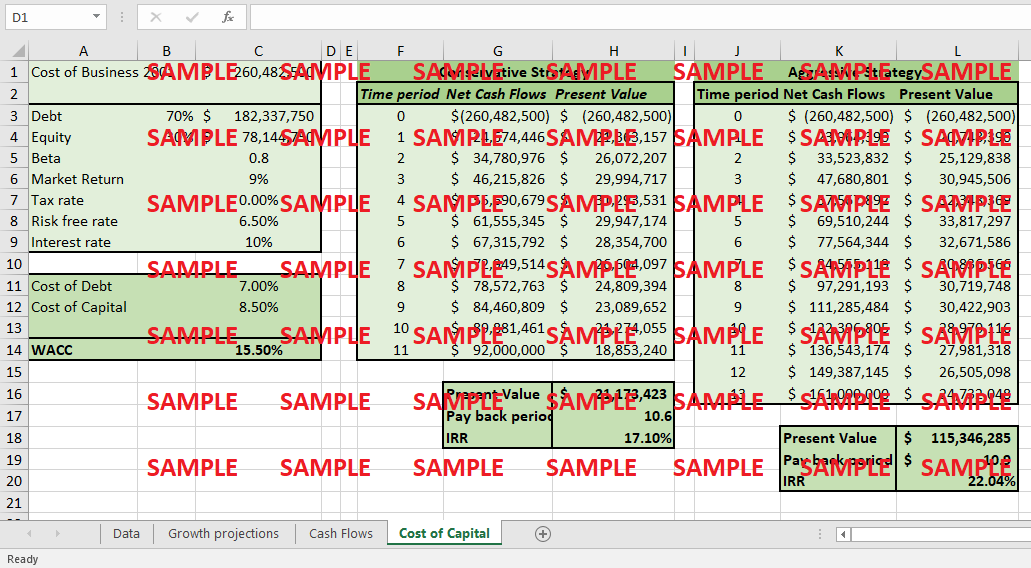
Cost of capital calculation is mainly done on the basis of several different assumptions and it is important to note that assumptions largely impact the calculations ( Jacobs & Shivdasani, 2021). The assumptions for the beta and the interest rate have been made in absence of any published information from the company. The market return of 10% is assumed as of average return of U.S capital markets using the S&P index for benchmarking (Royal & Arielle O, 2021). The assumptions about the company’s selected capital structure are also made as of 70% debt and 30% equity. Since Columbia alloys is a complete equity-based company the assumptions are made to analyze the situation from a completely different standpoint i.e. to view from the perspective of high debt. This will help in the evaluation of the capability of the company to deal with the debt burden and will help in analyzing the impact of debt leverage on the profitability of the company in the long run. Any combination of debt and equity can be assessed with the help of the model. The weighted average cost of capital based on the above assumptions was found as below
|
Cost of Debt |
|
7.00% |
|
Cost of Capital |
|
9.30% |
|
|
|
|
|
WACC |
|
16.30% |
In addition to IRR, some other metrics are also used for analysis including the net present value and payback period method. Since all these methods have their own advantages and limitations they are used simultaneously.Net present value, for example, provides the exact estimated numeric value using cash flows but it does not consider the opportunity cost (Efinance management, 2021). The payback period on the other hand is simple to calculate but does not consider the return rates. The analysis shows that both NOPV and payback period are in favor of an aggressive strategy as the value of NPV is greater and the payback period is slightly higher 10.9 as compared to 10.6 in the conservative strategy (Exhibit 3). This makes the aggressive strategy a more desirable and rational decision for the company as it would be able to generate a large amount of cash in the almost same time period. The difference of recovery of initial investment is roughly 03 months in both strategies with higher return sin aggressive strategy.
4. Final Recommendation
The approaches used in the above analysis show that aggressive strategy is more beneficial in terms of IRR, NPV, and payback period for the company. Although it might have to rely on debt for initial expansion with large cash outflows the returns are higher and profitability would be greater in the aggressive strategy in the long run. It is therefore recommended for the company to choose an aggressive strategy.
Get instant access to this case solution for only $19
Get Instant Access to This Case Solution for Only $19
Standard Price
$25
Save $6 on your purchase
-$6
Amount to Pay
$19
Different Requirements? Order a Custom Solution
Calculate the Price
Related Case Solutions
Get More Out of This
Our essay writing services are the best in the world. If you are in search of a professional essay writer, place your order on our website.

