Get instant access to this case solution for only $19
Finnegan's Gardens Case Solution
| Solution Id | Length | Case Author | Case Publisher |
|---|---|---|---|
| 698 | 1111 Words (3 Pages) | Mark E. Haskins, Kristy Lilly, Liz Smith | Darden School of Business : UV1706 |
Finnegan’s Gardens, owned by Patrick Finnegan, provided three main services to its customers; landscape designing services, maintenance services and installation services. After four years of operation, Finnegan wanted to expand his business. He had to decide which of the three services to expand. For this purpose, financial analysis was required after allocating the fixed overheads to the three services. Hence, different methods are used for overhead allocation is used. Due to high profit margin, it is recommended that, if there are no additional overheads, Finnegan should expand the Maintenance department. If overheads increase with expansion, Installation department should be expanded.
Following questions are answered in this case study solution:
-
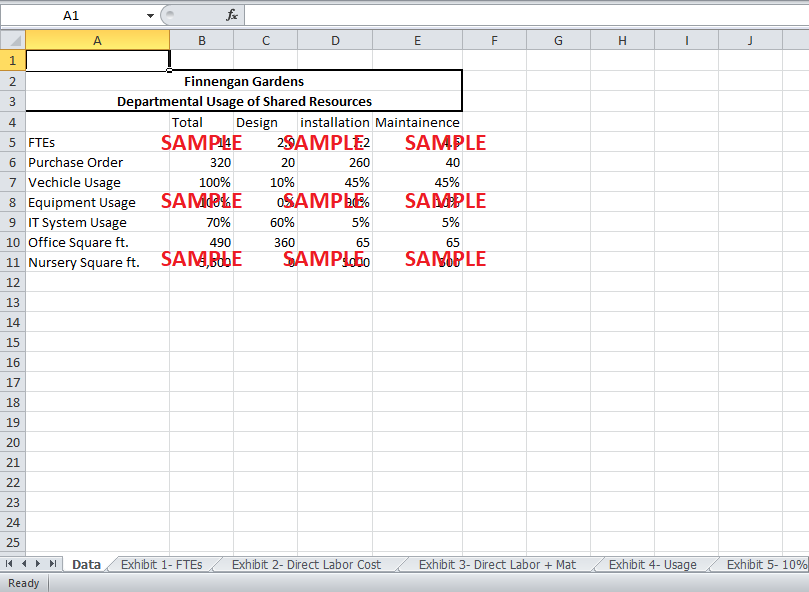
Using the information given in the case, allocate the company’s shared costs to each service line four different ways: based on FTEs, direct-labor costs, direct labor plus direct materials, and the specific usage information given to Finnegan by Bennett.
-
Calculate the profit percentage for each service line under each overhead-allocation method.
-
Which service line is the most financially attractive? Does the fact that design and installation clients often use Finnegan’s Gardens for maintenance services change your answer?
-
Assume volume and revenues for each service line could grow by 10%. Which service line should Finnegan expand? Is your answer congruent with your answer to Question 3? Why or why not?
Finnegan s Gardens Case Analysis
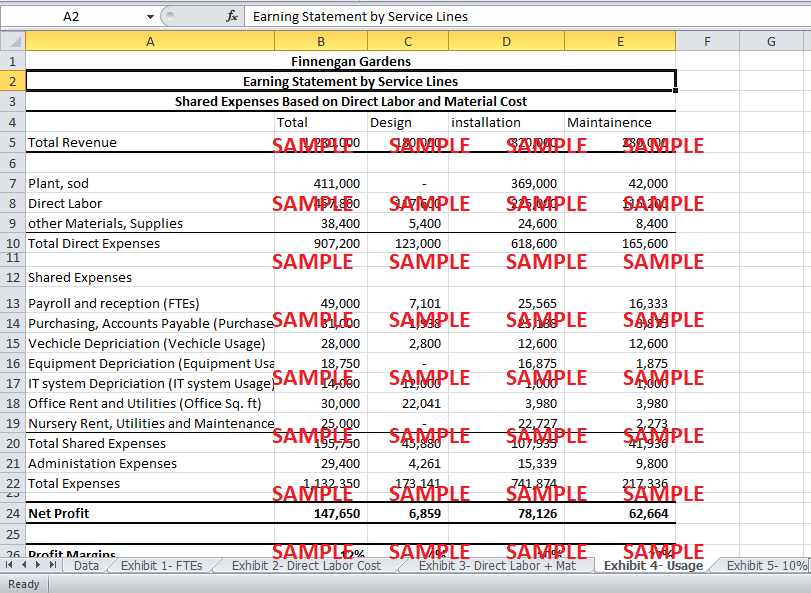
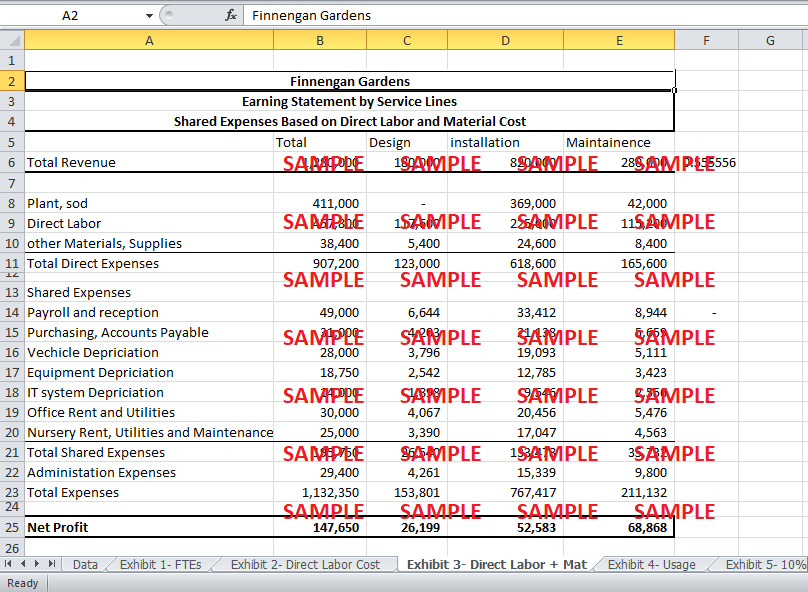
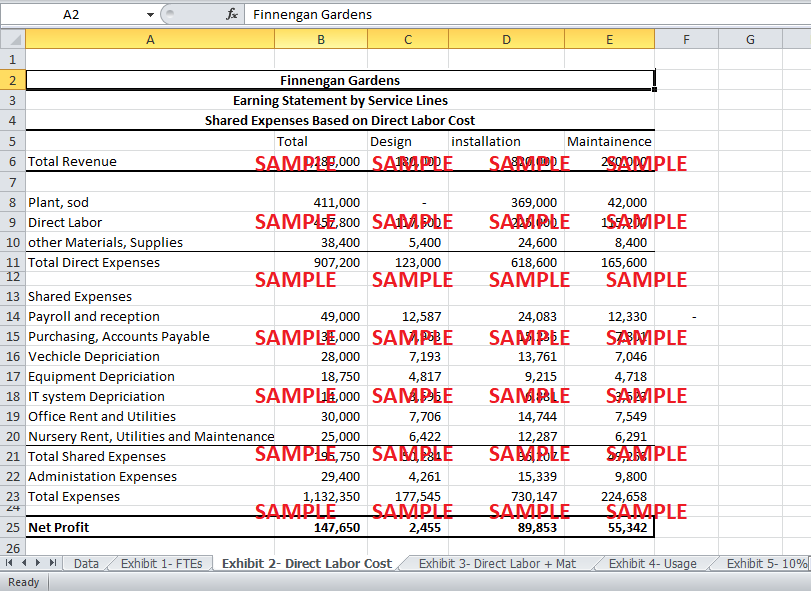
1.Using the information given in the case, allocate the company’s shared costs to each service line four different ways: based on FTEs, direct-labor costs, direct labor plus direct materials, and the specific usage information given to Finnegan by Bennett.
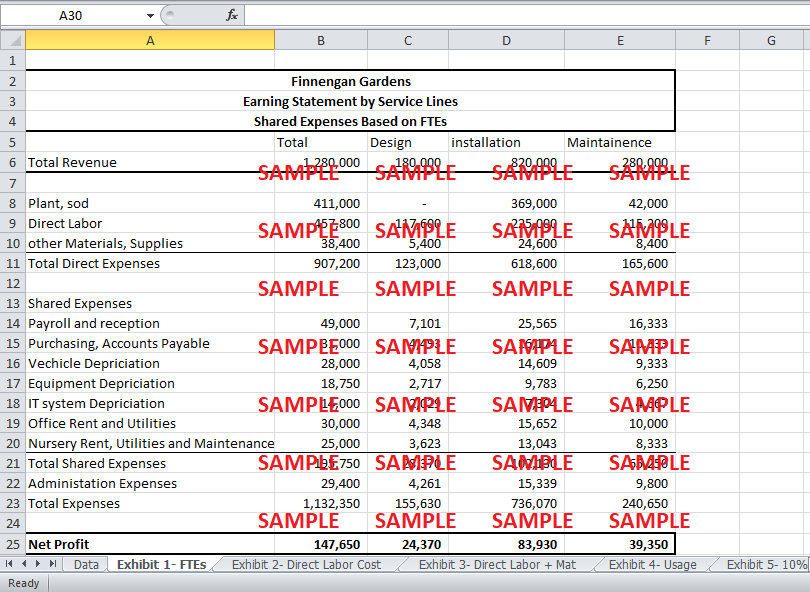
Exhibit 1 shows the distribution of shared expenses based on Full Time Employees (FTEs). The general expenses sharing based on only direct labor cost and total direct cost is shown in Exhibit 2 and Exhibit 3, respectively. The best overhead allocation Method is dividing the shared expenses based on their specific usage. Hence, for this method cost drivers are assigned to each shared expense as shown in Exhibit 4. Based on these cost drivers the overheads are allocated. For example, the Purchasing and Accounts payable expense is shared based on the proportion of purchase orders of each department.
All the exhibits with different cost allocation method show that Installation has the maximum share of overheads. This is due to more direct cost and revenue associated with the Installation department.
2. Calculate the profit percentage for each service line under each overhead-allocation method.
The Profit percentages for each service based on FTEs, direct labor cost, direct cost and specific usage is shown in Exhibit 1, Exhibit 2, Exhibit 3 and Exhibit 4, respectively. The most profitable service using any of these methods is Maintenance. However, the least profitable service differs based on the method used. When the allocation is based on FTEs and total direct costs, Installation has the lowest profitability at 10% and 6%. However, when Labor cost and specific usage method are used, Design has the lowest profitability.
Administration is not a service department. Therefore, the direct labor cost of administration is divided among the three departments based on the full time employees’ information given in the case.
3. Which service line is the most financially attractive? Does the fact that design and installation clients often use Finnegan’s Gardens for maintenance services change your answer?
As specific usage method is the best for the allocation of overheads, this method is used for the analysis of profitability.
The profit margin of the Maintenance Department is the highest. As the maintenance department is most profitable using any of the four allocation methods, it is the most financially attractive service for Finnegan’s Gardens. The reason for this high profitability is that the maintenance department earns 56% more revenue than the design department, but it only has 35% more expenses than the design department.
If the design and installation clients use Finnegan’s Garden for maintenance, Maintenance department would still remain the most financially attractive option for expansion. In this case, it means that some of the maintenance expenses, direct or indirect, are incurred because the department is working for design and installation clients. Moreover, the revenue from these services goes to design and installation. Hence, The Maintenance department is more profitable than calculated in the Exhibits.
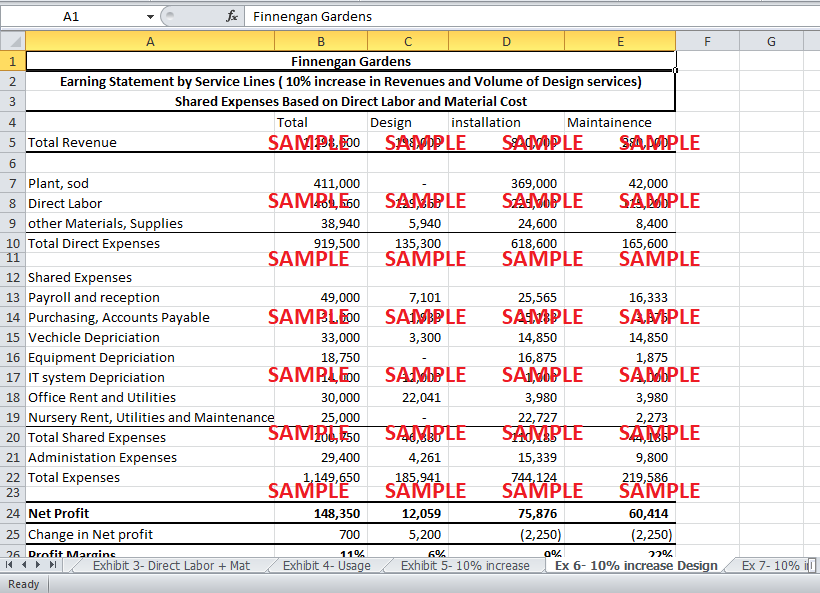
4. Assume volume and revenues for each service line could grow by 10%. Which service line should Finnegan expand? Is your answer congruent with your answer to Question 3? Why or why not?
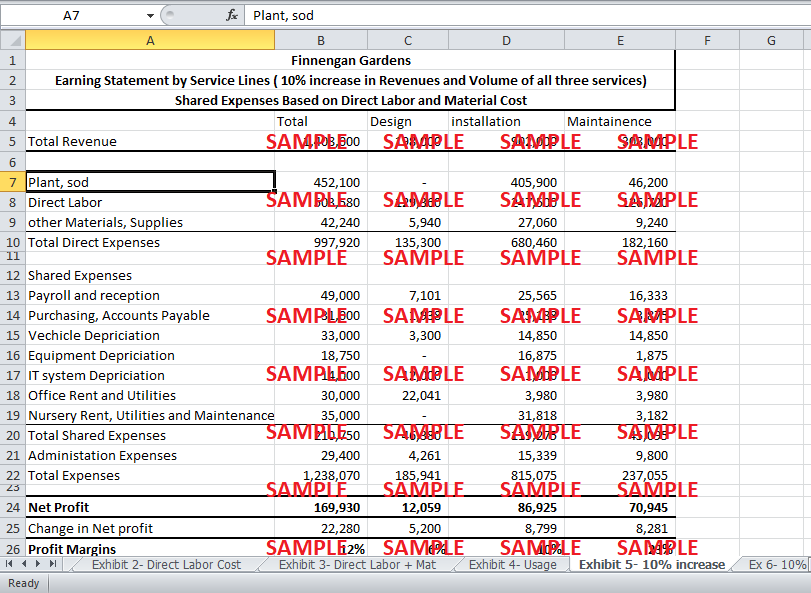
If the volume and revenues increase for each service increase by 10%, the direct expenses will also increase by 10%. However, most of the fixed overhead will not be affected with the increase in volume and revenue. For the 10% increase in services, the capacity needs to be increased by buying a vehicle for $25,000 (with 5 years useful life) and renting additional nursery space for $10,000. Therefore, in the overheads $5000 additional vehicle depreciation and $10,000 additional Nursery rent will be charged.
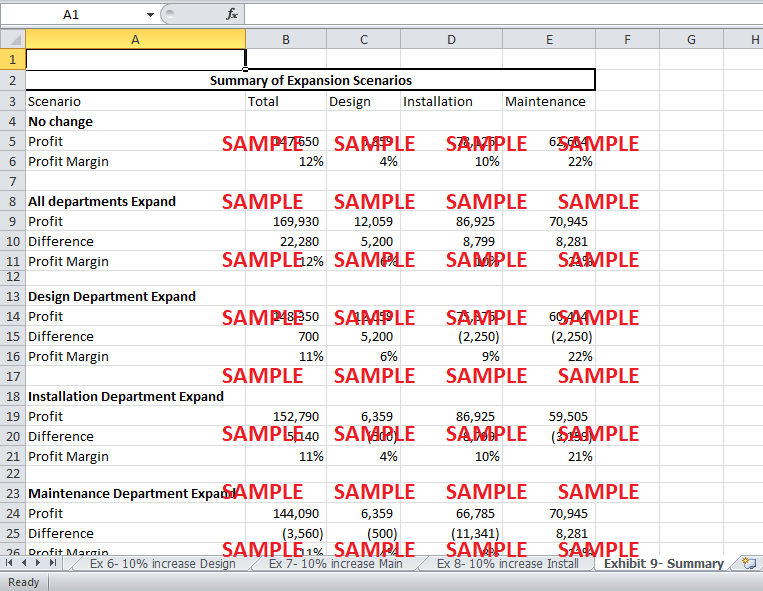
Exhibit 5 shows the impact of these changes on the profitability of each service. Maintenance remains the most profitable as the profit margin are the highest. The extra $25,000 investment and $10,000 rent has a detrimental effect on the profits. However, the profits from an increase in revenue are higher than the profit from the original revenue. The reason for this is the increase in revenue is higher than the increase in fixed cost when the capacity is being increased. Hence, the overall profits rise by $22,280.
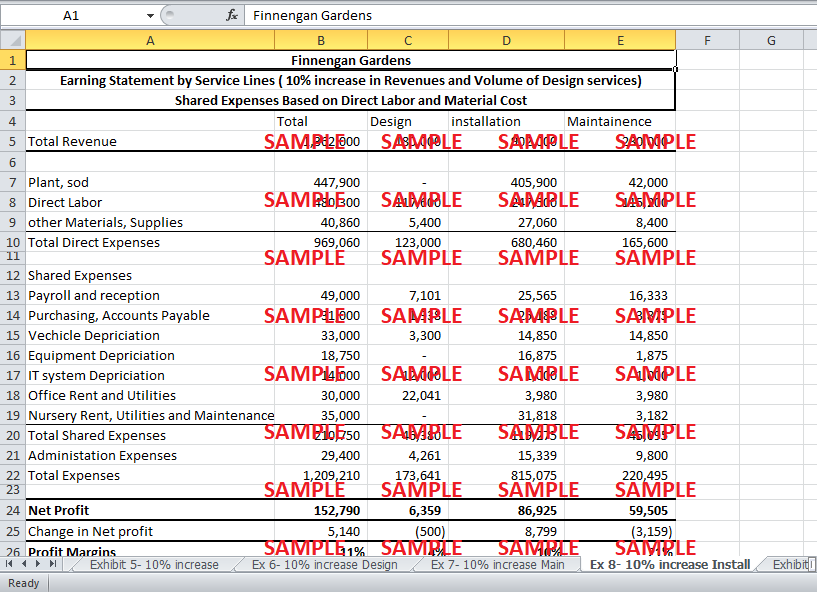
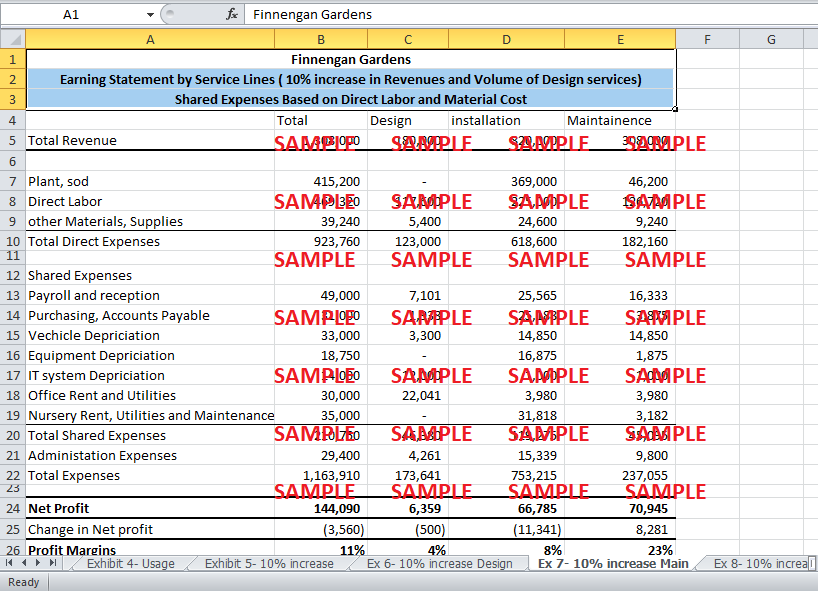
The $10,000 extra rent expense can be avoided by only expanding the Design Department. Exhibit 6 shows the impact of this expansion. If Design Department expands, the vehicle still has to be bought, and the increase in depreciation expense is apportioned onto the other two departments. This would reduce the profitability of other two departments. The profitability of the design department will rise due to a rise in revenue. Nevertheless the overall profit will only rise slightly by $700.
Get instant access to this case solution for only $19
Get Instant Access to This Case Solution for Only $19
Standard Price
$25
Save $6 on your purchase
-$6
Amount to Pay
$19
Different Requirements? Order a Custom Solution
Calculate the Price
Related Case Solutions
Get More Out of This
Our essay writing services are the best in the world. If you are in search of a professional essay writer, place your order on our website.

