Get instant access to this case solution for only $19
Mercury Athletic Footwear Case Solution
| Solution Id | Length | Case Author | Case Publisher |
|---|---|---|---|
| 836 | 1772 Words (9 Pages) | Timothy A. Luehrman, Joel L. Heilprin | Harvard Business School : 4050 |
West Coast Fashions, Inc has decided to dispose off one of their segments, Mercury Athletic. The head of the business development for Active Gear, Inc, John Liedtke, view this event as a good opportunity to acquire Mercury Athletic. This decision is mainly driven by the fact that AGI is highly profitable, but its size is very small in comparison with other highly profitable companies. This acquisition can help AGI gain more market share and size so that it can contend with the leading competitors. Some evident synergy effects like revenue boosting, market share enhancement and suppliers’ diversification have made Mercury a very suitable target. However, Liedtke is yet unsure about the resulting cash flows the acquisition will bring in. Liedtke wants to make sure that besides the ‘evident synergies’, there should be some financial benefit of acquiring Mercury. He wants to find out the enterprise value of Mercury using a discounted cash flow approach by utilizing a suitable cost of capital.
Following questions are answered in this case study solution:
-
Is Mercury an appropriate target for AGI?
-
Review the projections formulated by Liedtke. Are they appropriate? How would you recommend modifying them?
-
Estimate the value of Mercury using a discounted cash flow approach and Liedtke’s base case projections. Be prepared to defend additional assumptions you make?
-
Do you regard the value you obtained as conservative or aggressive? Why?
-
How would you analyze the possible synergies or other sources of value not reflected in Liedtke’s base case assumptions?
Mercury Athletic Footwear Case Analysis
1. Is Mercury an appropriate target for AGI?
AGI is a profitable company; however, its size is not large enough to cater for market expansion opportunities. For making a decision regarding the acquisition being appropriate or not, the facts and side effects of acquisition should be considered first.
i. Facts
-
The line of business of mercury is similar to that of AGI.
-
Both the companies carry out manufacturing in China.
-
There is a chance of geographical diversification as Mercury caters to different demographics than AGI.
-
Additional cost is to be entertained to synergize the inventory management systems.
-
The acquisition will help AGI expand to more retailers and distributors.
ii. Side Effects
-
Mercury will help AGI to roughly double its revenue.
-
Mercury has a higher growth rate than AGI. Therefore, it can help AGI to raise its post acquisition growth rate.
-
Mercury’s manufacturing costs are quite low in comparison with AGI. This effect can lead to decrease the overall manufacturing costs for AGI.
-
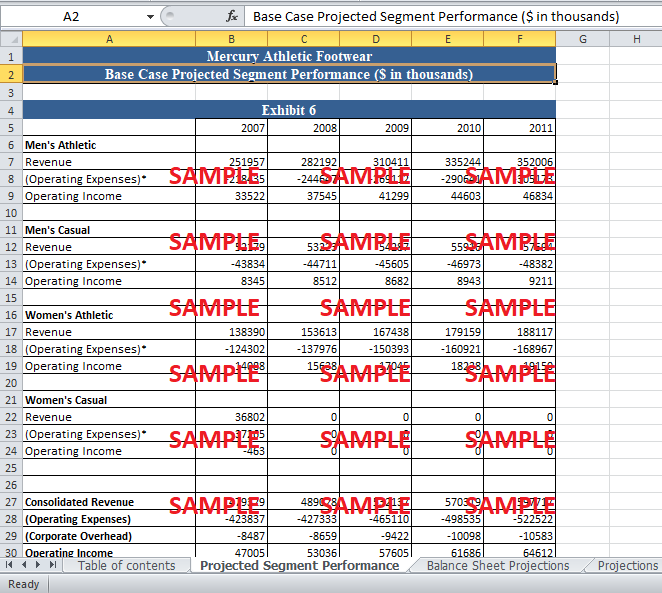
The men’s casual segment for AGI brought the highest revenue. At the same time, Mercury secures highest profit margin from this same segment. The synthesis of both can be very beneficial.
iii. Decision
All the facts and side effects are in affirmation of the decision of acquiring Mercury, and the acquisition looks reasonably appropriate. The possible business and financial synergies will be enormous. At the same time, the acquisition will help AGI to gain more market share and expand its business operations.
2. Review the projections formulated by Liedtke. Are they appropriate? How would you recommend modifying them?
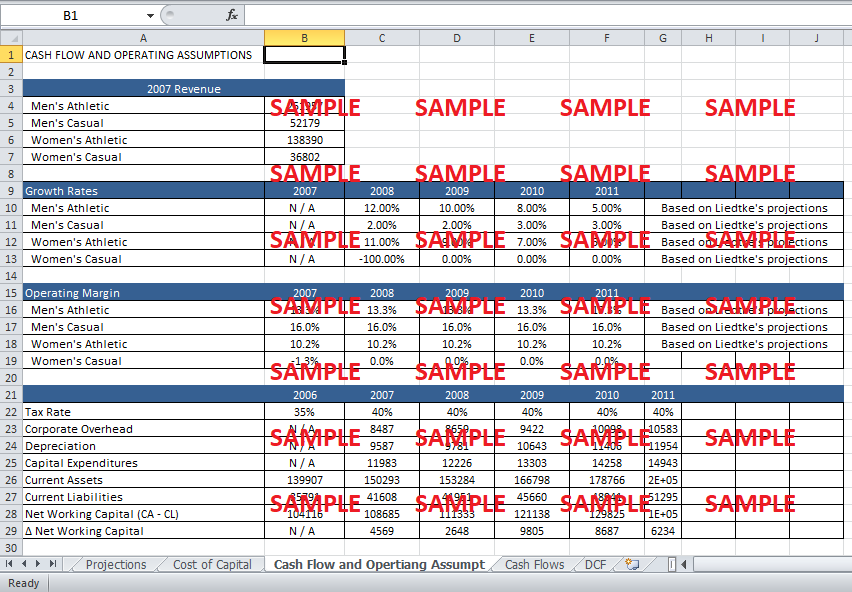
There are three basic assumptions for the projections.
-
Overhead to revenue ratio will follow the historical trends.
-
Women’s casual line for mercury will be wound down in the first year.
Let’s review all the projections one by one.
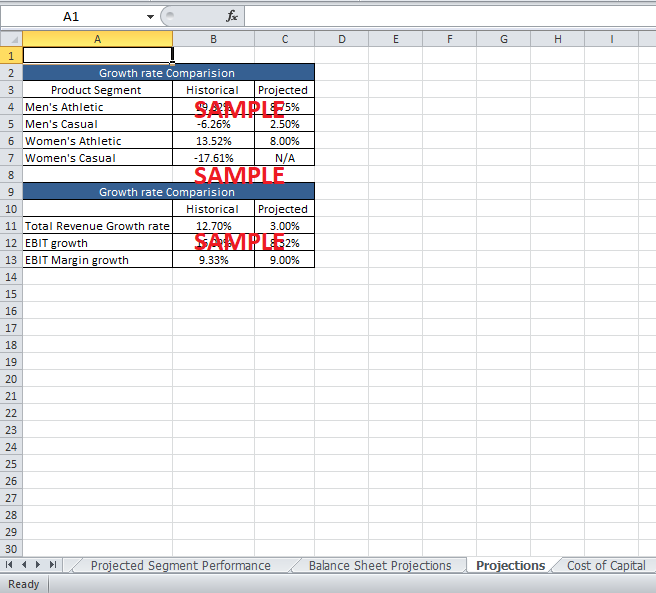
i. Growth rate projections
The following figure portrays the growth rate projections for different segments.
Table 1: Growth rate Comparison
|
Growth rate Comparison |
||
|
Product Segment |
Historical |
Projected |
|
Men's Athletic |
29.82% |
8.75% |
|
Men's Casual |
-6.26% |
2.50% |
|
Women's Athletic |
13.52% |
8.00% |
|
Women's Casual |
-17.61% |
N/A |
Source: Self Drawn
The projected growth rates for men’s athletic and women’s athletic seem very pessimistic. Men’s athletic projected rate is way below than the historical average which does not looks appropriate. Men’s casual segment growth rate is projected at 2.5%, which seems very appropriate as this segment brings the highest profit margin for Mercury and after acquisition, the growth rate should increase. As women’s casual line is written down, there is no projected growth rate for this segment.
Table 2: Income statement growth rates
|
Growth rate Comparison |
||
|
|
Historical |
Projected |
|
Total Revenue Growth rate |
12.8% |
3% |
|
EBIT growth |
16.09% |
8.32% |
|
EBIT Margin growth |
9.33% |
9% |
Source: Self Drawn
The historical revenue growth rate for Mercury for the last two years is 12.8%. In the case of acquisition, the combined revenue growth rate is projected at 3%. The combined growth rate seems inappropriate, as after acquisition the combined company is destined to grow at an enhanced growth rate.
ii. Women’s Casual Line projections and modification
Liddkte has wound off the women’s casual line after 2007, due to its low profitability. This wounding has a peculiar effect on the valuation of the company. It lowers the overall revenue and subsequently decreases the enterprise value for acquisition. This might be a good idea to write off women line completely for valuation purposes; however, after the acquisition the AGI should merge the Mercury women’s casual line with its line to gain some more revenue and higher return for investors.
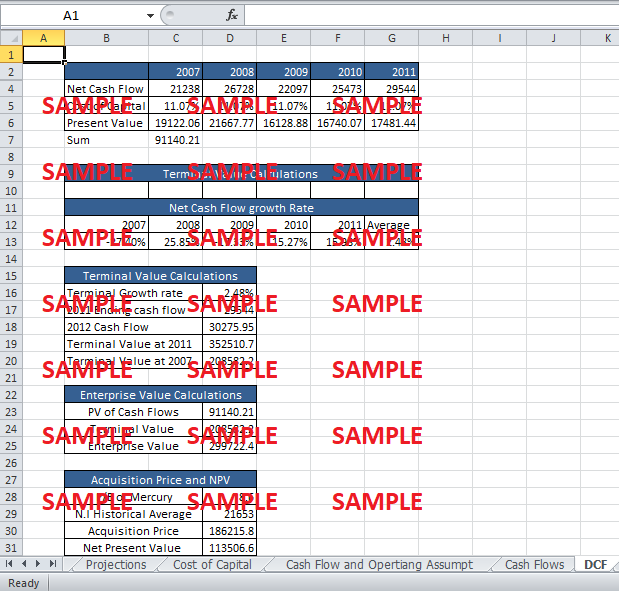
3. Estimate the value of Mercury using a discounted cash flow approach and Liedtke’s base case projections. Be prepared to defend additional assumptions you make?
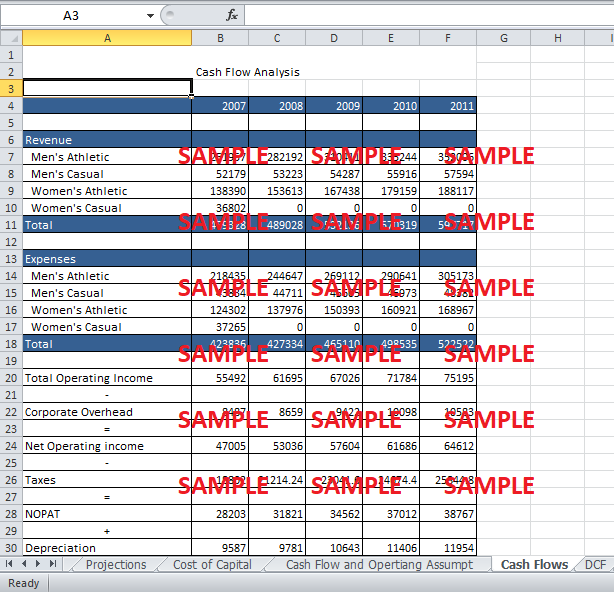
In the discounted cash flow approach, the following formula is used to calculate the cash flow.
Cash Flow = Net operating Income - taxes + Depreciation - ∆Net working Capital - Capital Expenditures
However, before moving forward to the cash flow calculations, it is crucial to estimate an appropriate cost of capital for the project and also make some assumptions regarding cost of capital.
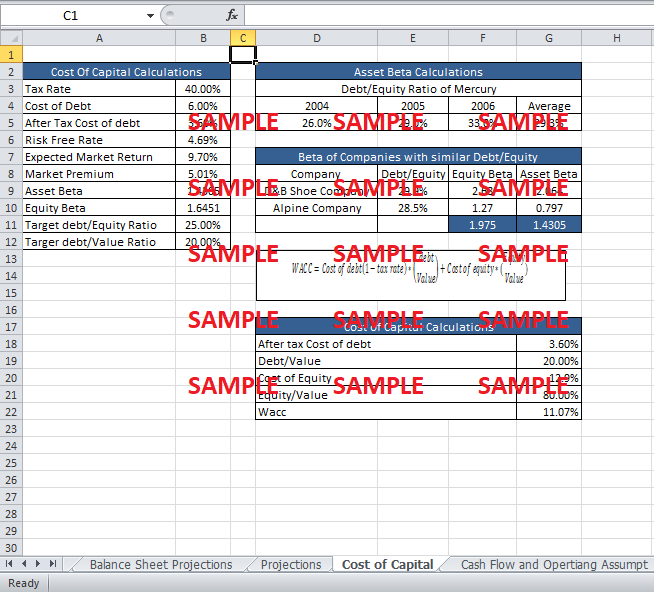
i. Assumptions
-
Beta for mercury is calculated by comparison with the companies having similar debt/equity ratio. The beta of the assets is taken from the data and then is levered to get the equity beta. This beta is used in the calculation of cost of equity afterwards. The equity beta comes out to be 1.64.
-
For calculations of the acquisition price, the P/E is taken to be 8.6. The acquisition price is calculated by multiplying this value with the historical average of net income. Thus, the acquisition price comes out to be $186215.
-
Risk free rate is taken to be 4.69% while the market risk premium is 5.01%.
-
The following formula is used to calculate the WACC. The cost of debt is taken to be on an after tax basis to further to account for the depreciation tax shield.
-
The terminal growth rate is equal to the average growth of cash flow of the last five years. It comes out to be 2.78%.
ii. Cash Flows
Table 3: Cash Flow Analysis
|
|
2007 |
2008 |
2009 |
2010 |
2011 |
|
|
|
|
|
|
|
|
Revenue |
|
|
|
|
|
|
Men's Athletic |
251957 |
282192 |
310411 |
335244 |
352006 |
|
Men's Casual |
52179 |
53223 |
54287 |
55916 |
57594 |
|
Women's Athletic |
138390 |
153613 |
167438 |
179159 |
188117 |
|
Women's Casual |
36802 |
0 |
0 |
0 |
0 |
|
Total |
479328 |
489028 |
532136 |
570319 |
597717 |
|
|
|
|
|
|
|
|
Expenses |
|
|
|
|
|
|
Men's Athletic |
218435 |
244647 |
269112 |
290641 |
305173 |
|
Men's Casual |
43834 |
44711 |
45605 |
46973 |
48382 |
|
Women's Athletic |
124302 |
137976 |
150393 |
160921 |
168967 |
|
Women's Casual |
37265 |
0 |
0 |
0 |
0 |
|
Total |
423836 |
427334 |
465110 |
498535 |
522522 |
|
|
|
|
|
|
|
|
Total Operating Income |
55492 |
61695 |
67026 |
71784 |
75195 |
|
- |
|
|
|
|
|
|
Corporate Overhead |
8487 |
8659 |
9422 |
10098 |
10583 |
|
= |
|
|
|
|
|
|
Net Operating income |
47005 |
53036 |
57604 |
61686 |
64612 |
|
- |
|
|
|
|
|
|
Taxes |
18802 |
21214.24 |
23041.6 |
24674.4 |
25844.8 |
|
= |
|
|
|
|
|
|
NOPAT |
28203 |
31821 |
34562 |
37012 |
38767 |
|
+ |
|
|
|
|
|
|
Depreciation |
9587 |
9781 |
10643 |
11406 |
11954 |
|
- |
|
|
|
|
|
|
Increase in net working capital |
4569 |
2648 |
9805 |
8687 |
6234 |
|
- |
|
|
|
|
|
|
Capital Expenditures |
11983 |
12226 |
13303 |
14258 |
14943 |
|
= |
|
|
|
|
|
|
Net Cash Flow |
21238 |
26728 |
22097 |
25473 |
29544 |
Source: Self Drawn
After calculating all the relevant variables, all the cash flows are setup so that they could be discounted back to get the present value. The net cash flow at the end of 2011 is used to calculate the terminal value. Following formula is used to calculate the terminal value.
The following table depicts the terminal value calculations.
Get instant access to this case solution for only $19
Get Instant Access to This Case Solution for Only $19
Standard Price
$25
Save $6 on your purchase
-$6
Amount to Pay
$19
Different Requirements? Order a Custom Solution
Calculate the Price
Related Case Solutions
Get More Out of This
Our essay writing services are the best in the world. If you are in search of a professional essay writer, place your order on our website.

