Get instant access to this case solution for only $19
Roches Acquisition of Genentech Case Solution
| Solution Id | Length | Case Author | Case Publisher |
|---|---|---|---|
| 912 | 2237 Words (8 Pages) | Carliss Y Baldwin, Bo Becker, Vincent Dessain | Harvard Business School : 210040 |
To gain distribution rights and attain financial synergies, Hummer Roche, the chairman of Roche Corporation is planning to acquire Genentech, a biotech subsidiary of Roche. According to the analysis performed, this acquisition has potentially rewarding benefits and also bears some unwanted risks. At the same time, if Roche accepts the counter offered proposed by the special committee, the value of synergy will be lower than the paid premium. Roche should not adhere to the offer price and also should not initiate a tender offer. Roche should stick to his valuation and continue to re-offer the price of $89. However, Roche should not take the risk of waiting till the clinical trials of the Genentech’s new cancer drug. This may prove devastating as in the case of favorable results the share price will rise, and consequently the counter offer ‘per share price’ would also increase.
Following questions are answered in this case study solution:
-
Why is Roche seeking to acquire the 44% of Genentech it does not own? From Roche's point of view, what are the advantages of owing 100% of Genentech? What are the risks?
-
As of June 2008, what is the value of the synergies Roche anticipates from a merger with Genentech? Assess the value of synergies per share of Genentech. Please use a 9% weighted average cost of capital in your analysis.
-
Based on DCF valuation techniques, what range of values is reasonable for Genentech as a stand-alone company in June 2008? Please exclude synergies from your valuation and use a a 9% weighted average cost of capital. You can assume that as of the end of June 2008, Genentech held approximately $7 billion in cash, which included investments and securities that were not needed in its daily operations. (Note: Exhibit 10 is a good starting point for this analysis.)
-
What does the analysis of comparable companies (Exhibit 12, 13, and 14) indicate about Genentech's value within the range established in question 3?
-
How has the financial crisis affected Genentech's value? What changes in valuation assumptions occurred between June 2008 and January 2009?
-
What should Franz Humer do? Specifically, should he launch a tender offer for Genentech's shares? What are the risks of this move? What price should he offer? Should he be prepared to go higher? How much new financing will Roche need to complete the tender offer?
-
How did Genentech’s board and management respond to Roche’s offer of $89 per share?

Roches Acquisition of Genentech Case Analysis
1. Why is Roche seeking to acquire the 44% of Genentech it does not own? From Roche’s point of view, what are the advantages of owing 100% of Genentech? What are the risks?
Currently, Roche owns 56% of Genentech shares. It is a time when international pharmaceutical industry is least innovative in product design. As a result, the competition among products of different pharmaceutical companies is increasing day by day. The two principal goals of this acquisition are the possible ‘enhanced future growth’ and ‘financial synergies’.
Advantages
-
If this acquisition offer is successfully accomplished, then from the total assets point of view, Roche would become the largest pharmaceutical company in the international scenario.
-
Total control over Genentech would empower Roche to access its patents and the R&D developments. Current holding percentage and consequent conflict of interest with Genentech’s minority shareholders outlaw Roche from these privileges.
-
The largest probable benefit would derive from the financial synergies. These synergies will chiefly arise from the reduction in various heads of expenses.
-
Roche will have the right to distribute the best selling drugs of Genentech outside the US market. This would help boost the earnings of the company.
Risks
-
There is quite a possibility that Roche may end up paying a much high premium in comparison with the value of synergies (winner’s curse). This is mainly because of the following two facts.
A: Desire of acquiring Genentech is very strong.
B: Genentech may reject the offer if it does not encompass a high premium.
-
Most of the minority shareholders of Genentech are its employees. In the case of a hostile takeover, most of the business practices and prevalent ‘family environment’ company culture would be destroyed. In the context of long run growth, this risk is very crucial as it may render the most essential component of Genentech useless, the ‘human capital’.
-
In case of the offer acceptance, Roche has to borrow an additional $30 billion of debt in the aftermath of financial crises. The current global financial situation may heighten the interest rate on debt, making the debt extra expensive.
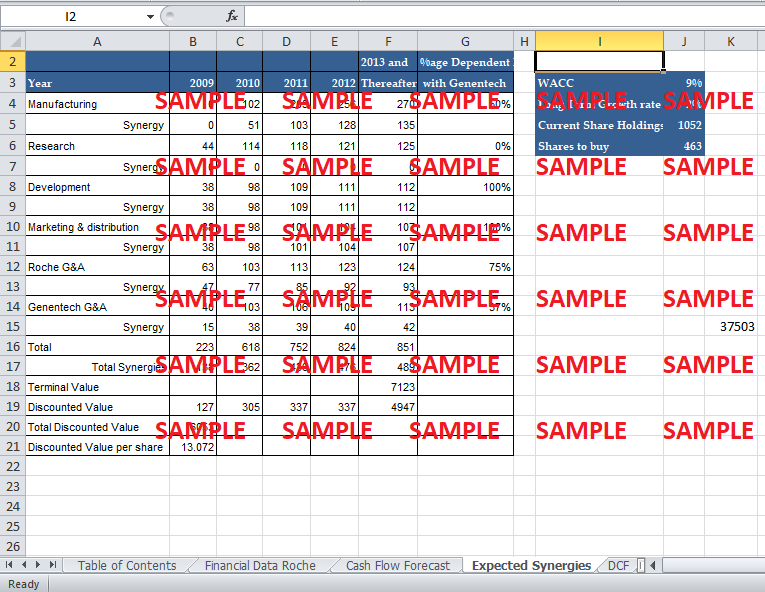
2. As of June 2008, what is the value of the synergies Roche anticipates from a merger with Genentech? Assess the value of synergies per share of Genentech. Please use a 9% weighted average cost of capital in your analysis?
In the current context, Synergy can be defined as the increase in the value of business due to the inclusion or addition of another entity. The inclusion of Genentech in the business will provide financial benefits that Roche could not have attained working on its own. The biggest benefit would arise from the savings or cutting of overall expenses. After the acquisition, both the companies would be able to decrease their expenses mainly because of the sharing of expenses.
The flowing table represents the calculations pertaining to the valuation of synergy.
|
|
|
|
|
|
2013 and |
%age Dependent Merger |
|
Year |
2009 |
2010 |
2011 |
2012 |
Thereafter |
with Genentech |
|
Manufacturing |
0 |
102 |
205 |
256 |
270 |
50% |
|
Synergy |
0 |
51 |
103 |
128 |
135 |
|
|
Research |
44 |
114 |
118 |
121 |
125 |
0% |
|
Synergy |
0 |
0 |
0 |
0 |
0 |
|
|
Development |
38 |
98 |
109 |
111 |
112 |
100% |
|
Synergy |
38 |
98 |
109 |
111 |
112 |
|
|
Marketing & Distribution |
38 |
98 |
101 |
104 |
107 |
100% |
|
Synergy |
38 |
98 |
101 |
104 |
107 |
|
|
Roche G&A |
63 |
103 |
113 |
123 |
124 |
75% |
|
Synergy |
47 |
77 |
85 |
92 |
93 |
|
|
Genentech G&A |
40 |
103 |
106 |
109 |
113 |
37% |
|
Synergy |
15 |
38 |
39 |
40 |
42 |
|
|
Total |
223 |
618 |
752 |
824 |
851 |
|
|
Total Synergies |
138 |
362 |
436 |
476 |
489 |
|
|
Terminal Value |
|
|
|
|
7123 |
|
|
Discounted Value |
127 |
305 |
337 |
337 |
4947 |
|
|
Total Discounted Value |
6053 |
|
|
|
|
|
|
Discounted Value per Share |
13.072 |
|
|
|
|
In the calculation of discounted value per share, all the values of synergy (including the terminal and annual values) are discounted at the present time. All the pertinent values are discounted back at the weighted average cost of capital. The WACC is assumed to be 9%. The terminal value is calculated using the long-term (post 2013) growth rate of 2%. This rate is the same as the post 2018 growth rate. In the calculation of per share synergy value, only the 44% of un-acquired shares are taken into consideration.
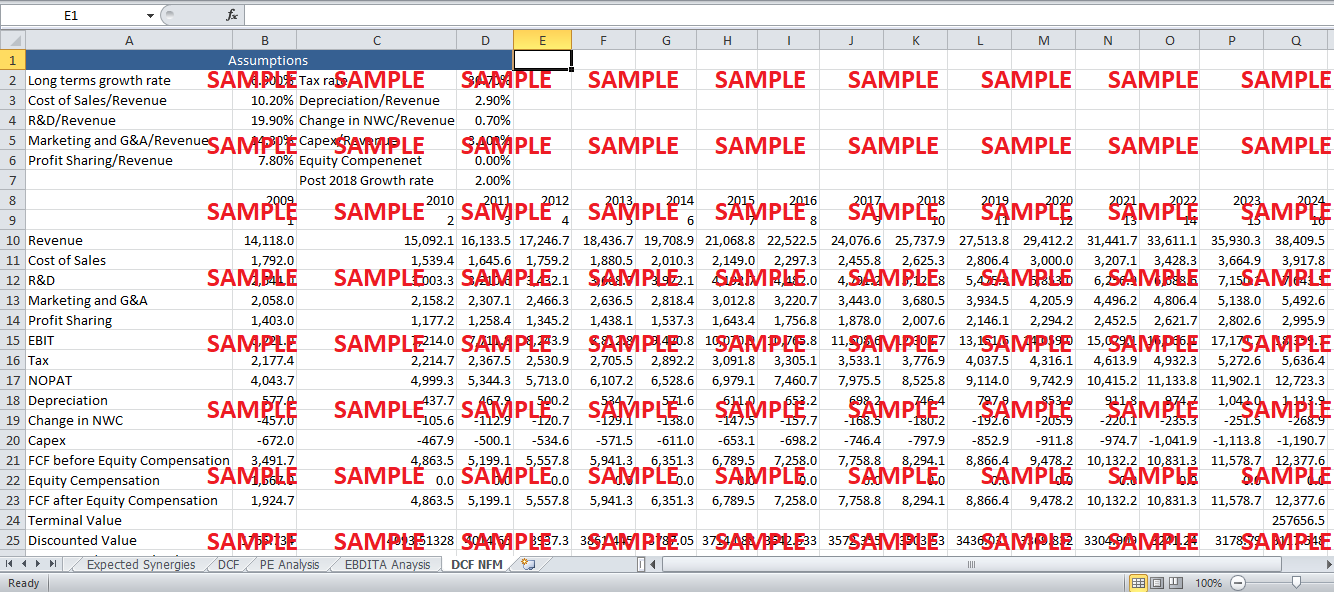
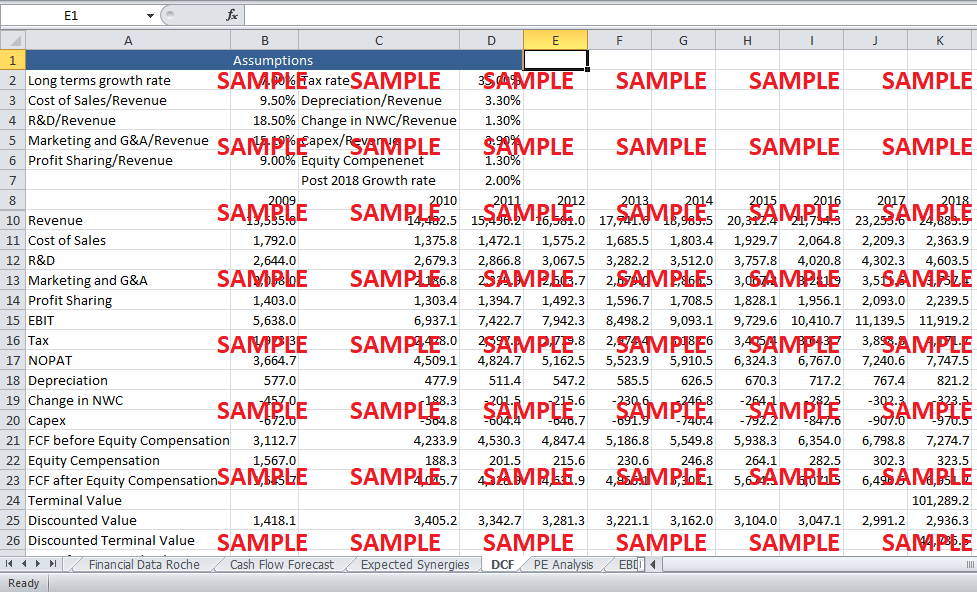
3. Based on DCF valuation techniques, what range of values is reasonable for Genentech as a stand-alone company in June 2008? Please exclude synergies from your valuation and use a 9% weighted average cost of capital. You can assume that as of the end of June 2008, Genentech held approximately $7 billion in cash, which included investments and securities that were not needed in its daily operations.
The DCF valuation technique uses a suitable cost of capital to discount all the free cash flows of the company. The free cash flow is calculated by using the following formula:
FCF = NOPAT + Depreciation and Amortization - ∆ Net working Capital - Capital Expenditure
Where,
NOPAT = Net operating profit after tax
After all the free cash flows are generated, the terminal value of the FCF is calculated using the following formula:
Terminal Value = (FCF(2018) * (1 + long term growth rate)) / (WACC - long term growth rate)
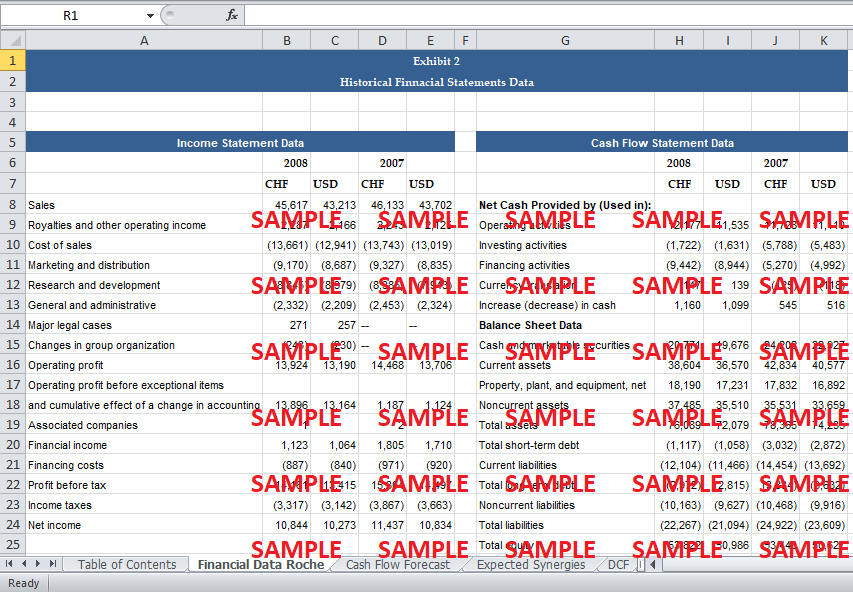
For the base case, the long term growth rate and the annual revenue growth rates are assumed to be 2% and 7% respectively. The base case enterprise value comes out to be $72695 million. After enterprise value calculations, equity is valued using the following table.
|
Equity Valuation |
|
|
Enterprise Value |
72,694.6 |
|
Commercial Paper |
-500 |
|
Long term Debt |
-2329 |
|
Cash and Securities |
7000 |
|
Equity Value |
76,865.6 |
|
Total Shares Outstanding |
1052 |
|
Value per Share |
73.0661488 |
The values of debt are subtracted, and the 2008 ending cash and marketable securities are added back to get the equity value. This value is divided by the value of total outstanding shares to get the value per share, which comes out to be $73.
However, the value per share would change when the average annual growth rate and the long terms growth rates are changes. Therefore, it is important to analyze the value per share for different values of both these variables. The following table depicts the output of data table for different values of both of the underlying variables.
|
Scenario Analysis of per Share Price |
|||||
|
Long term rate/ Annual rate |
1.0% |
1.5% |
2.0% |
2.5% |
3.0% |
|
5.0% |
64.03 |
64.19 |
64.36 |
64.53 |
64.70 |
|
6.0% |
68.20 |
68.38 |
68.57 |
68.75 |
68.93 |
|
7.0% |
72.67 |
72.87 |
73.07 |
73.27 |
73.46 |
|
8.0% |
77.45 |
77.67 |
77.88 |
78.10 |
78.32 |
|
9.0% |
82.56 |
82.80 |
83.04 |
83.27 |
83.51 |
The annual growth rate of 6-9% coupled with the long term rate of 1-3% yield the value per share for the range of $63 to $83. These values are consistent with the calculations of Greenhill. The possible range of value per share is between $64 and $83.
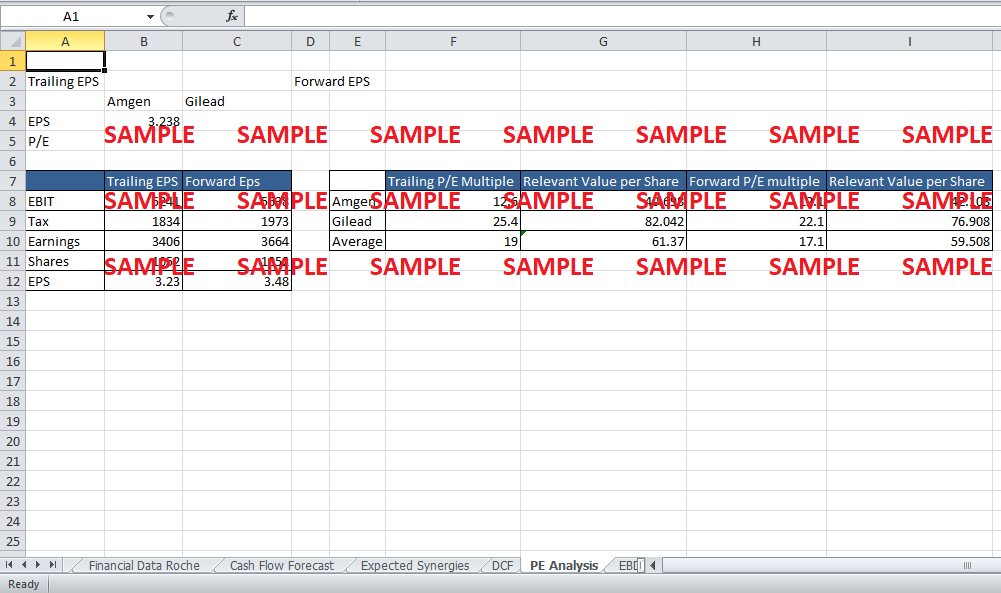
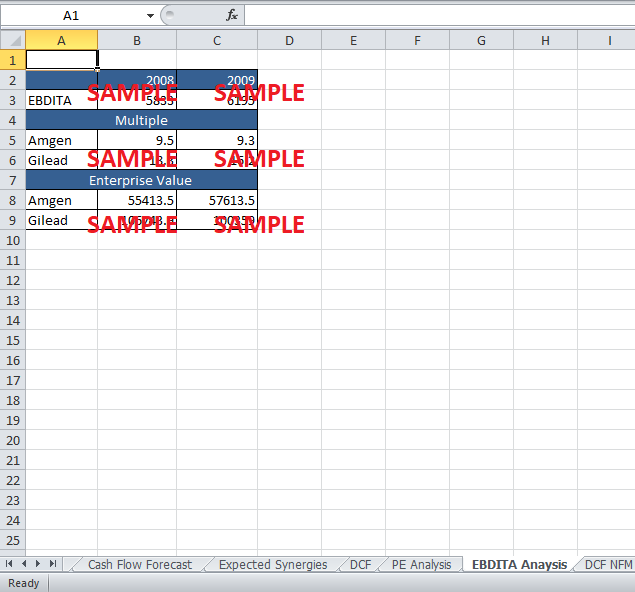
4. What does the analysis of comparable companies (Exhibit 12, 13, and 14) indicate about Genentech’s value within the range established in question 3?
Before moving onto the comparable companies’ analysis, it is vital to take the following two points into consideration while choosing the related companies for comparison.
-
Firstly, the Company to be compared should be in the same industry. Genentech operates in the bio-tech industry. Therefore, only biotech companies are to be compared.
-
Secondly, the company should be of the same size, i.e. around equal equity value.
There are only two companies that satisfy the criteria, namely, Amgen and Gilead sciences. Even for these two companies, the market value of equity is way below than that of Genentech’s; nevertheless, the two companies are on 2nd and 3rd position in terms of equity value.
First of all, it is important to establish a range based on P/E multiple comparisons. The following table provides the analysis pertaining to the P/E calculations.
Get instant access to this case solution for only $19
Get Instant Access to This Case Solution for Only $19
Standard Price
$25
Save $6 on your purchase
-$6
Amount to Pay
$19
Different Requirements? Order a Custom Solution
Calculate the Price
Related Case Solutions
Get More Out of This
Our essay writing services are the best in the world. If you are in search of a professional essay writer, place your order on our website.

