Get instant access to this case solution for only $19
University of Trent Case Solution
| Solution Id | Length | Case Author | Case Publisher |
|---|---|---|---|
| 1429 | 1351 Words (8 Pages) | Regina E. Herzlinger | Harvard Business School : 177245 |
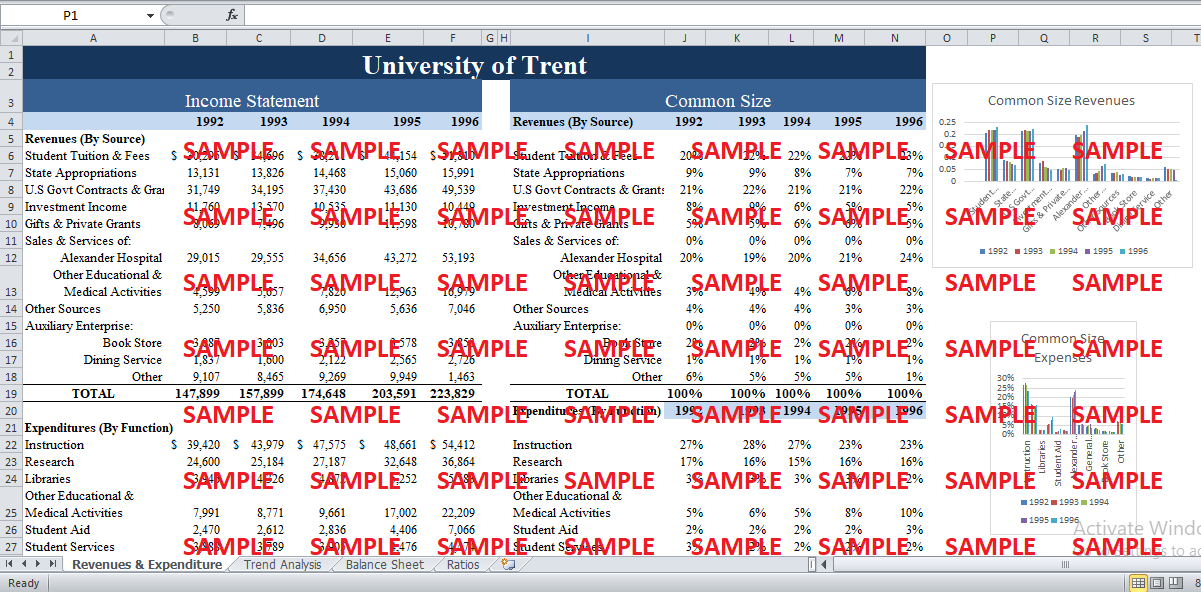
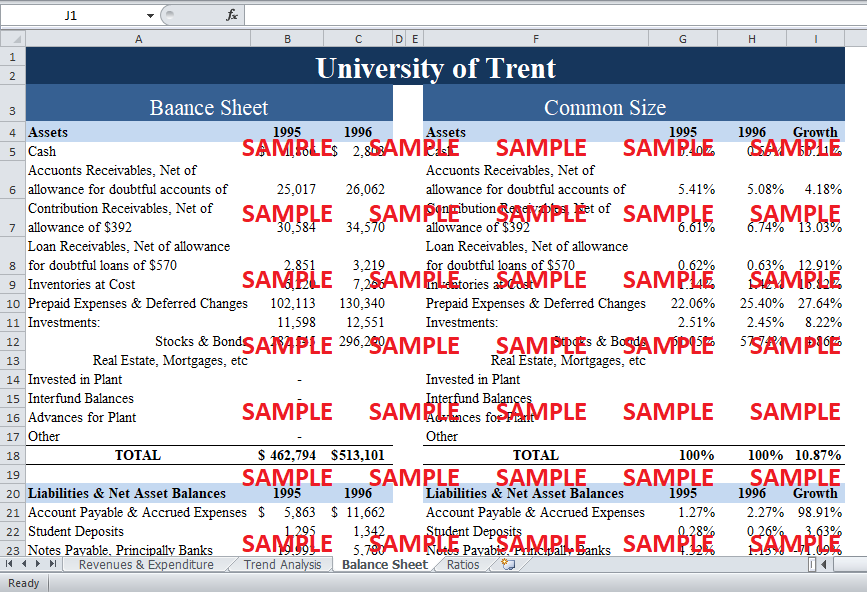
The financial position of the University of Trent improved to some extent. The asset and liabilities of the University increased from $463 million to $513 million which is approximately 11% higher than the previous year. The major reason for the increase in assets was that the University was able to increase its cash significantly. The cash was increase by 50% from $1,866,000 to $2,803,000. Also, Contribution Receivables also upturn over the year by 13% from $30 Million to $34 Million. Inventories and Prepaid expenses also significantly increased in 1996 by 17% and 27% respectively. On the liability side, accounts payables almost doubled over the year. Payables increase from $5.8 Million to $11.6 Million. The notes payables reduced substantially by 71%. Reserves also increase by 46.19%.
Following questions are answered in this case study solution
-
Analyze the financial position of the University of Trent using the data in Exhibit 1A and 1B.
a. Comparison of 19X5 to 19X6
b. Common-size balance sheets for the two years
c. Trend analysis for Revenues and Expenses 19X2 to 19X6
d. Common-size trend analysis for Revenues and Expenses 19X2 to 19X6
e. Ratios
-
Evaluate Chip’s performance in terms of the technical quality of the changes he made and the methods he used to implement them
-
Do you think Chip’s overall performance is helpful to the University of Trent? Why? If you think his performance is less than perfect, specify how he should change it.
-
Are the University of Trent’s goals consistent with the financial resources it needs to finance them? Explain.
-
Is the University of Trent maintaining intergenerational equity? Explain.
-
Is there an appropriate match between the sources of resources and the uses to which they are put? Explain. Are present resources sustainable? Explain.
Case Analysis for University of Trent
The asset side of the common size balance sheet is shown in Exhibit 1. In order to calculate the common size assets all the individual assets are divided by the total assets.
Exhibit 1
|
Common Size |
||
|
Assets |
1995 |
1996 |
|
Cash |
0.40% |
0.55% |
|
Accounts Receivables, Net of allowance for doubtful accounts of $3977 |
5.41% |
5.08% |
|
Contribution Receivables, Net of allowance of $392 |
6.61% |
6.74% |
|
Loan Receivables, Net of allowance for doubtful loans of $570 |
0.62% |
0.63% |
|
Inventories at Cost |
1.34% |
1.42% |
|
Prepaid Expenses & Deferred Changes |
22.06% |
25.40% |
|
Investments: |
2.51% |
2.45% |
|
Stocks & Bonds |
61.05% |
57.74% |
|
TOTAL |
100% |
100% |
The liabilities and equity side of the common size balance sheet is shown in Exhibit 2. The percentages are calculated by dividing each head with total liabilities & net worth.
Exhibit 2
|
Common Size |
||
|
Liabilities & Net Asset Balances |
1995 |
1996 |
|
Account Payable & Accrued Expenses |
1.27% |
2.27% |
|
Student Deposits |
0.28% |
0.26% |
|
Notes Payable, Principally Banks |
4.32% |
1.13% |
|
Long Term Debt |
13.62% |
18.46% |
|
Advances on Research Contracts |
0.81% |
0.85% |
|
deferred Income |
0.60% |
0.57% |
|
Agency Funds |
0.16% |
0.18% |
|
Reserves |
0.33% |
0.43% |
|
Net Asset Balances |
78.61% |
75.84% |
|
TOTAL |
100% |
100% |
Trend Analysis for Revenues & Expenses
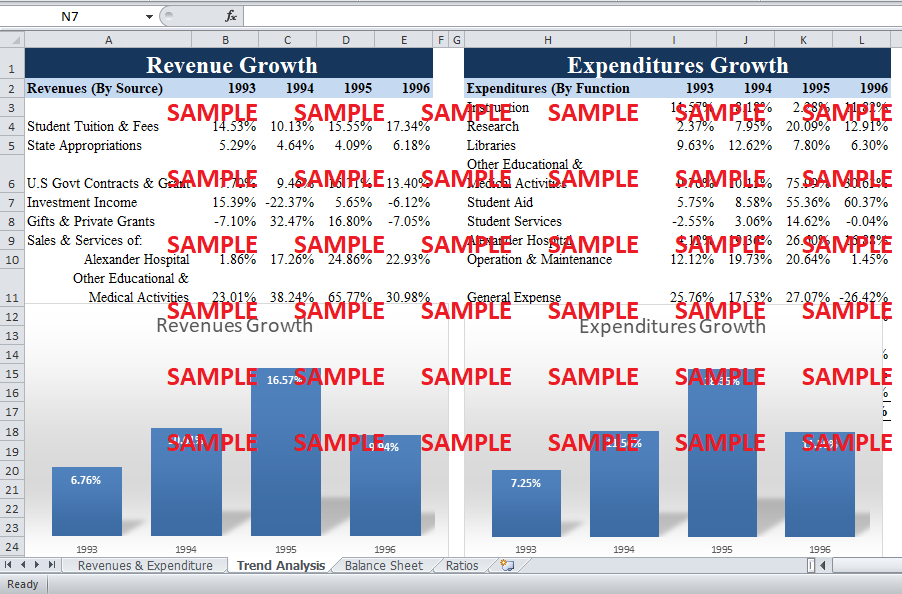
In order to perform a trend analysis on revenues and expenditures, the growth rates for both have been estimated. Exhibit 3 shows the growth of revenues from 1993 to 1994. As shown in the graph, the total revenues grew by 6.67% in 1993 then followed by 10.61% growth in 1994.
Exhibit 3

The overall expenses are also increased by 7% in 1993 as compared to 1992. Exhibit 4 shows the expense growth from 1992 to 1996. University incurred maximum expenses in 1995 when expenses grew by 18% whereby the revenue growth was 16%.
Exhibit 4

Common Size Trend analysis for revenues & expenditures
Exhibit 5 shows the trend analysis of revenues from 1992 to 1996. As seen by the graph most of the different revues sources are consistent over the years.
Exhibit 5

Exhibit 6 shows the common size expenses and clearly expenses are more or less same in the following years as a % of total expenses
Exhibit 6

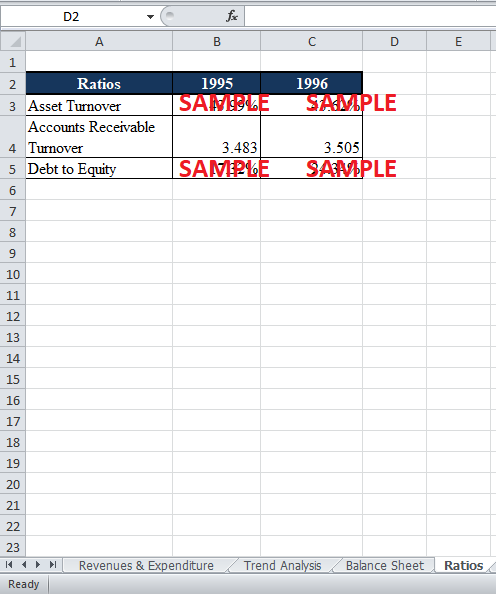
Some ratios calculated are shown in Exhibit 7. The debt to equity ratio increases significantly as compared to the other two ratios.
Exhibit 7
|
Ratios |
1995 |
1996 |
|
Asset Turnover |
43.99% |
43.62% |
|
Accounts Receivable Turnover |
3.483 |
3.505 |
|
Debt to Equity |
17.32% |
24.34% |
2. Evaluate Chip’s performance in terms of the technical quality of the changes he made and the methods he used to implement them
Chip took some aggressive measures regarding the activities of different units. Firstly, he in order to boost the bookstore sales and to get rid of the obsolete inventory of books, he managed to hold inventory sales which paid off in the form of increased revenues. In the long run, he tried to convince the management to run the book store as a separate entity.
The dining hall was not generating the volume enough to cover the cost and the contract with the outsourcing service Chuckwagon was such that it only shares the profit, so he got rid of them. This allowed him to reduce costs. Moreover, the smart guy that was out in charge of the dining service also proved to be a successful move. The physical plant that was the major reason for the budget deficit was a big operation. Here Chip hired ahead an inside guy and installed an automated system that calculated the overtime, vacation time and sick leave. This is a brilliant idea to cut costs and overtime.
3. Do you think Chip’s overall performance is helpful to the University of Trent? Why? If you think his performance is less than perfect, specify how he should change it.
The overall performance of the chip is satisfactory in terms of his ability to cut costs in major business units. Chip has taken some measures that had enabled him to cut costs and overtime in auxiliary enterprises. But there is still room for improvement in his negotiating ability.
Get instant access to this case solution for only $19
Get Instant Access to This Case Solution for Only $19
Standard Price
$25
Save $6 on your purchase
-$6
Amount to Pay
$19
Different Requirements? Order a Custom Solution
Calculate the Price
Related Case Solutions
Get More Out of This
Our essay writing services are the best in the world. If you are in search of a professional essay writer, place your order on our website.

