Get instant access to this case solution for only $19
University Of Trent Case Solution
| Solution Id | Length | Case Author | Case Publisher |
|---|---|---|---|
| 1842 | 2094 Words (7 Pages) | Regina E. Herzlinger | Harvard Business School : 177245 |
There is no doubt that the measures introduced by Chip are of great value to the University. Chip has done well to improve the performance of the Auxiliary services. As the results from the financial analysis indicate, the company has produced better financial results in 1996. The bookstore has reported profits for the first time in five years. The profits, albeit small, are expected to increase during the next year. Similarly, the dining centre has also reported a decrease in the proportionate gap between revenues and expenses. Indeed, Chip has helped them save a few hundred thousand by removing the outsourced company Chuckwagon. The introduction of an automated system for workers in the physical plant is also a constructive measure.
Following questions are answered in this case study solution
-
Analyze the financial position of the University of Trent using the data in Exhibit 1A and 1B.
-
Evaluate Chip’s performance in terms of the technical quality of the changes he made and the methods he used to implement them.
-
Do you think Chip’s overall performance is helpful to the University of Trent? If you think performance is less than perfect, specify how he should change it.
Case Analysis for University Of Trent
1. Analyze the financial position of the University of Trent using the data in Exhibit 1A and 1B.
University of Trent has launched an extensive funding program where they are seeking to gather donations for their future operations. However, the historical financial performance of the University is viewed as not providing adequate assurance to the donors. Trent has increased its revenues consistently, but the expenditures have increased at an even more drastic rate. Thereby, the company has not been able to control its expenses and has run into losses. We present a trend analysis of the financial performance of the university over the past few years. The income statement ratios are calculated for the past five years, while the balance sheet ratios are calculated for only the past two years due to non-availability of relevant data.
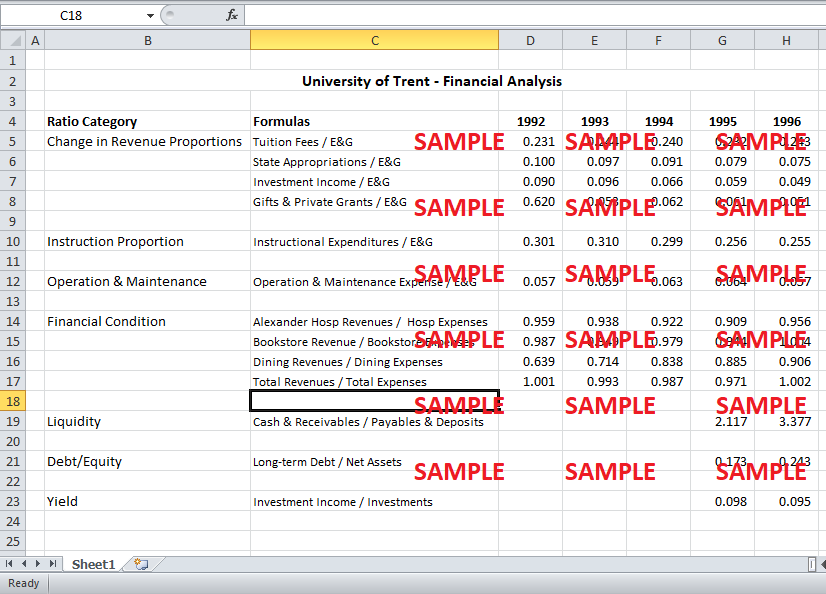
It has already been mentioned that the major problem with Trent’s financial performance is viewed to be the relative changes in revenues and expenses over time. It is believed that the revenues have decreased in proportion to expenses. It is important to look at the ratios to verify this trend. These set of ratios are classified as ‘change in revenue proportions’ in the attached spreadsheet. The revenue from tuition fees, in proportion to education and general expenditure (E&G), has oscillated up and down over the past five years. The proportion of tuition fees increased from 1992 to 1993, but decreased over the two years (1994 and 1995). In 1995, the proportion of revenue was similar to its initial level of 1992. The revenue from tuition fees increased once again in 1996. However, the uncertain movements in this proportion prevent us from predicting future progress. Overall, it can be said that the tuition fees have increased slightly in proportion to expenditure, during the period from 1992 to 1996.
The proportion of revenue from state appropriations to educational and general expenditures has decreased constantly over the past five year. In 1992, this proportion was 0.100. It experienced a consistent decrease over the next five years, dropping to 0.075 in 1996. The situation is similar from other sources of revenues such as investment income and gifts and private grants. The revenues from these sources, in proportion to expenditure, have decreased over the past five years. This decline has been consistent and drastic, with the proportion of investment income decline by approximately 50% over the past five years.
It is also important to determine the types of expenditure that has been driving the embellished increase in expenditure. For this purpose, we can calculate a ratio of a couple of important expenditures to the total education and general expenditure (E&G). The ratio of instructional expenditure to educational and general expenditure has demonstrated changing trends. The ratio increased from 1992 to 1993, but decreased over the next two years (1994 and 1995). The trend is very similar to the trend observed in the ratio of tuition fees to expenditure. This implies that the tuition fees and instructional expenditure have been moving in close proportion to each other. However, as opposed to an increase in the ratio of tuition fees to E&G in 1996, the ratio of instructional expenditure to E&G remained constant from 1995 to 1996. Overall, the ratio of instructional expenditure to E&G decline from 0.301 in 1992 to 0.255 in 1996. On the contrary, the ratio of operation & maintenance increased gradually over the period from 1992 to 1995, before decreasing back to its initial (1992) level in 1996.
It is also important to conduct a profitability analysis of the independent revenue centers of the University. These revenue centers include Alexander hospital, bookstore, and dining centre. Ideally, these independent operations should be generated sufficient revenue to cover their expenses. A ratio of their revenue to their expenses has been used to determine their operating performance. A ratio that is higher than one implies that the operation is generating profits, where a ratio that is lower than one indicates loss-making operation. Before we delve into the profitability of these operations, we look at the overall ratio of total revenues to total expenses. The ratio starts from 1.001 in 1992, before declining to 0.971 by 1995. However, the ratio jumps back to 1.002 in 1996. In other words, the company is able to cover its expenses in 1992, but it starts making losses at an increasing rate during the next three years, before jumping back to a profitable position in 1996.
Alexander hospitals have not been able to make any profits during the past five years as its ratio of revenues to expenses is consistently below one. The ratio decreases at a constant rate from 0.959 in 1992 to 0.909 in 1995, before increasing back to 0.956 in 1996. The ratio of revenues to expenses for the bookstore has been oscillating up and down during the past five years. The ratio decreased from 1992 to 1993, then increased from 1993 to 1994, then decreased once again from 1994 to 1995, and finally increased from 1995 to 1996. However, the last increase from 1995 to 1996 was quite drastic as the ratio increased from its lowest value of 0.944 in 1995 to its highest value of 1.004 in 1996. In 1996, the bookstore recorded a profit for the first time in the last five years. For the dining centre, the ratio of revenues to expenses increased consistently over the past five years. The ratio was at a much lower level of 0.639 in 1992, indicating that the dining centre was incurring heavy losses. The ratio increased considerably over the past five years, reaching 0.906 in 1996.
Get instant access to this case solution for only $19
Get Instant Access to This Case Solution for Only $19
Standard Price
$25
Save $6 on your purchase
-$6
Amount to Pay
$19
Different Requirements? Order a Custom Solution
Calculate the Price
Related Case Solutions
Get More Out of This
Our essay writing services are the best in the world. If you are in search of a professional essay writer, place your order on our website.

