Get instant access to this case solution for only $19
Virginia Investment Partners Optimal Portfolio Allocation Case Solution
| Solution Id | Length | Case Author | Case Publisher |
|---|---|---|---|
| 1877 | 2247 Words (7 Pages) | Richard B. Evans | Darden School of Business : UV2558 |
The highest level of standard deviation in the portfolio is for S&P 500Index; that is 15.34%. This is the highest level of portfolio standard deviation possible to achieve as long as constrain of the sum of weight-ages being equal to 1 has to hold. However, in order to get a feasible solution for the portfolio for maximum return with standard deviation of 20%, constraint for sum weight-ages has to be changed. In place of the constraint of the sum of weight-ages being equal to 1, one should change it to greater or equal to 1. With these new sets of constraints, following feasible solution maximizes portfolio return for standard deviation of 20%.
Following questions are answered in this case study solution
-
Using the return data for IBM in Exhibit 1, calculate the mean and standard deviation for the stock.
-
Assume a portfolio with three equally weighted asset classes. Using the return data in Exhibit 1, calculate monthly return, mean and standard deviation. What arguments, for and against, could be made for clients to sell IBM and diversify into such a portfolio.
-
Using mean variance optimizers in Exhibit 2, calculate weights in the three asset classes for the optimal portfolio.
-
What is it you want to maximize?
-
What parameters could change in order to maximize the return of the portfolio?
-
What constraints should be placed on the optimized portfolio?
-
Repeat the exercise in 3 for target standard deviations of 2%, 6%, 14%, and 20%. To do this, just change the value in the portfolio target standard deviation cell and rerun Solver. Are all of these feasible portfolios? What additional assets or investment strategies would you need to reach these targets on the investment frontier? What impact would including these additional assets or investment strategies have the risk and return of the portfolio? Do these portfolios suggest additional constraints that should be placed on the Optimization?
-
Plot the portfolio return and standard deviation for each of the targets above and compare this graphically to the mean and standard deviation of the client’s current portfolio. Is this a compelling argument for diversification?
-
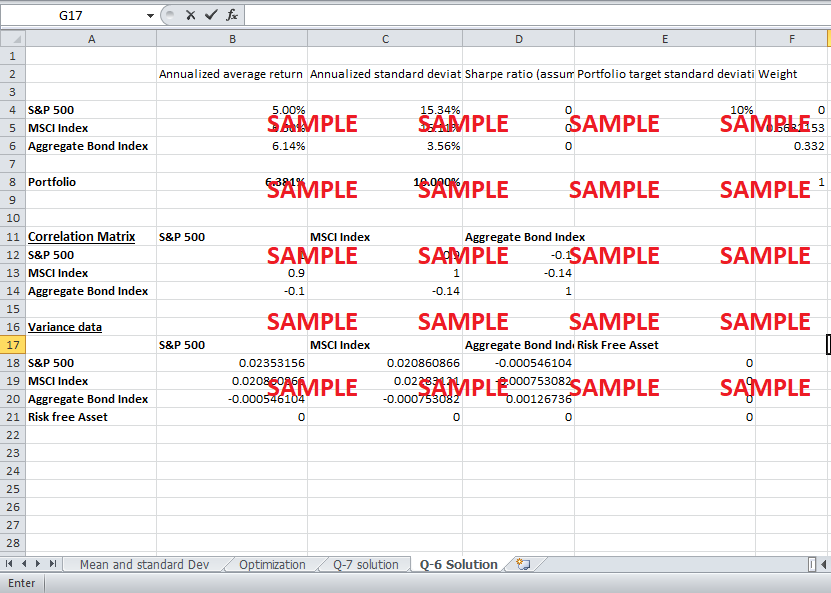
Given the current economic climate, the chief economist at VIP has suggested that the expected returns for U.S. and international equities be lowered to 5% and 6.5%respectively. He has also suggested that the correlation between the two should be increased to 0.9. Using these numbers, change the optimizer parameters and repeat the optimization for a target of 10%. How does this change your portfolio?
-
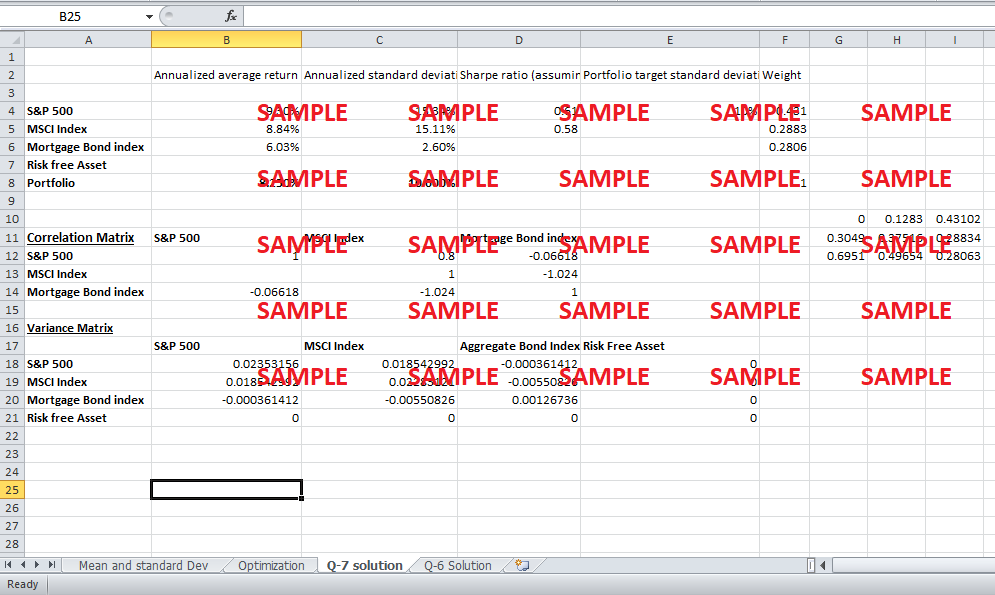
The Lehman Brothers Mortgage Backed Bond Index has a correlation of −0.1024 and −0.06618 with the MSCI World (excluding the United States) and the S&P 500 indices respectively. The average annualized return for the index was 6.03% and the average annualized standard deviation was 2.60%. Replace the average return, standard deviation, and correlation numbers for the Lehman Brother Aggregate Bond Index with the numbers above for the Lehman Brothers Mortgage Backed Bond Index and run the optimization again with target standard deviations of 2%, 6%, and 10%. What allocations do you get? How could such allocations contribute to our current economic climate? What fundamentally went wrong?

Case Analysis for Virginia Investment Partners Optimal Portfolio Allocation
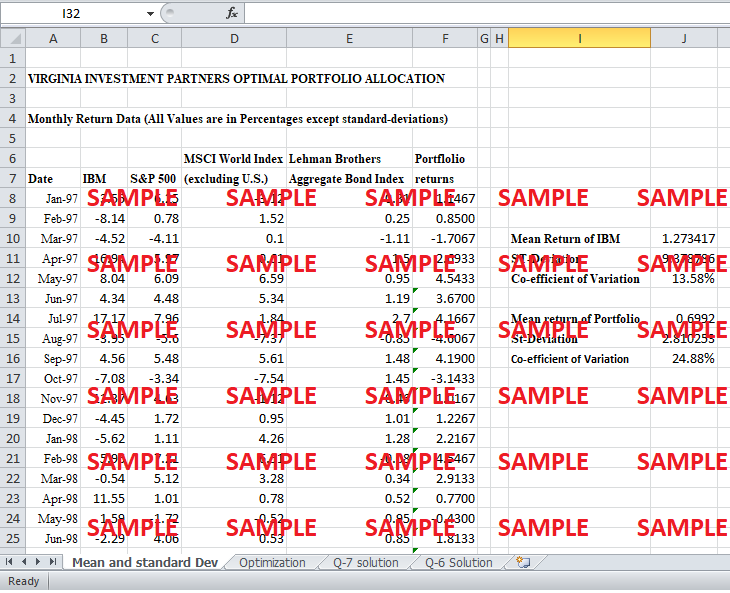
1. Using the return data for IBM in Exhibit 1, calculate the mean and standard deviation for the stock.
Exhibit 1 shows monthly return data of IBM for ten consecutive years. Therefore, 120 values of monthly returns are shown in exhibit. Mean monthly return of IBM has been calculated in excel using formulas. By using the average formula symbolized as “AVERAGE” in excel, monthly return comes out to be 1.273%. This mean return value over 120 months is quite low because there were a lot of negative return values and overall variation in the data was very high. The monthly return data of the company had shown very inconsistent results in last 10 years. Standard deviation of these monthly returns can also be calculated by using standard deviation formula in excel symbolized as “STDEV”. The standard deviation for the data comes out to be 9.378%.
2. Assume a portfolio with three equally weighted asset classes. Using the return data in Exhibit 1, calculate monthly return, mean and standard deviation. What arguments, for and against, could be made for clients to sell IBM and diversify into such a portfolio.
A portfolio consisting of three equally weighted classes of stock returns for MSCI world Index, Aggregate Bond index and S&P 500 can be made by assigning 33.33% weight-age to their respective monthly returns over 120 months. This is essentially the average of monthly returns of these three indices over a period of ten years. Thus, a separate column shows the rate of return for each month if the investor had invested equally in all three indices. The mean of these monthly return values comes out to be 0.6992%. Standard deviation of the monthly return data of this portfolio over ten years comes out to be 2.81%. If the mean and standard deviation of this portfolio are compared to mean and standard deviation of IBM, it can be seen that preference of an investor for one over the other depends upon his approach. For an investor who is not risk averse and who rates his investments solely based on their potential to give returns, regardless of the risk, IBM is clearly a better option. Mean rate of monthly return for IBM is higher than that of portfolio. However, most of the investors are risk averse and require a higher return for higher levels of risks. Apparently the data does not seem to help in making a decision because the risk of the portfolio is lower whereas, on the other hand, return of IBM is higher. In this situation, risk averse investor should use co-efficient of variation to decide a better option. Co-efficient of variation is the ratio of return over standard deviation as a percentage. Co-efficient of variation for IBM is 13.58% whereas; co-efficient of variation of the portfolio is 24.88%. In other words, return per unit risk is higher portfolio. Therefore, if given a choice between the two, a risk adverse investor will prefer portfolio over IBM for investment.
3. Using mean variance optimizers in Exhibit 2, calculate weights in the three asset classes for the optimal portfolio.
In order to calculate the mean variance optimizer, first the values of co-variances and variances for all three assets in our portfolio have to be calculated. In the Exhibit, values for correlations are given. These values can be used to find co-variances by multiplying them with standard deviations of the two assets between which correlation had been given initially. After calculating co-variances, annualized return and standard deviation for the portfolio should be calculated using formulas. Then, solver will calculate the required that maximize the return for a given value of standard deviation. The weights that are given by the solver to maximize the return of portfolio by keeping standard deviation at 10% are following.
Maximized portfolio return = 8.2265, S&P 500 Index = 54.59%, MSCI Index = 13.35% and Aggregate Bond Index = 32%.
If an investor wants to take the risk as high as 10% and at the same time wants to maximize the return of the portfolio, he should invest in S&P 500, MSCI Index and Aggregate Bond Index according to these percentages.
4. What is it you want to maximize?
The objective of this optimization method is to find out weights of the three classes of assets that give the maximum amount of return while keeping the risk level, symbolized by the standard deviation, at 10%. Therefore, the investor is trying to maximize the return of the portfolio by taking the maximum advantage of diversification due to correlation values less than one between different assets.
5. What parameters could change in order to maximize the return of the portfolio?
Rates of the returns of different assets in the portfolio are given as the inputs of the analysis. The same is true for standard deviations and correlations between different assets in the portfolio. So, these three are the inputs that an investor cannot change because they depend upon micro and macroeconomic changes. The only thing that an investor can change is the degree of investment in different assets to diversify away systematic as much as possible. Solver is trying to find out different weight-ages that should be invested in assets so that overall return of the portfolio can be maximized for a given level of standard deviation. Therefore, percentages of investments in different assets are the parameters that can change to maximize the return of the portfolio.
6. What constraints should be placed on the optimized portfolio?
Optimization method works only with a certain set of constraints, so that results are realistic. In real life, there are always constraints and hence, investors have to de cost benefit analysis. No matter, how attractive investments are investors can invest only a limited amount of capital due to capital constraints. Constraints that are relevant to the optimization of return are following.
-
Standard deviation had to be equal to 10% for the scenario posed in the above questions. However, this constraint can be changed according to our requirements of analysis.
-
Sum of the weight-ages of investments in different asset classes should be equal to 1.
Get instant access to this case solution for only $19
Get Instant Access to This Case Solution for Only $19
Standard Price
$25
Save $6 on your purchase
-$6
Amount to Pay
$19
Different Requirements? Order a Custom Solution
Calculate the Price
Related Case Solutions
Get More Out of This
Our essay writing services are the best in the world. If you are in search of a professional essay writer, place your order on our website.

